


Buyers Vanished From Toronto's Real Estate Market
Overview of important developments in the Toronto Metro housing market and macro reported in February 2025


Highlights
February recorded the lowest Toronto Metro sales for this month since 1995
Record listing terminations prevented an inventory buildup
The rental market weakened, with falling rent prices
New construction sales hit record lows for the ninth consecutive month
Population growth continues to slow, but permits issued to new non-permanent residents remain high
Toronto vs. Canada: A tale of two macroeconomic stories
Is Canada’s economy on track for a soft landing?
The U.S.-Canada trade war could cause a temporary spike in inflation and leave lasting economic damage
Real Estate Market
One key development in the Toronto Metro real estate market in February was a decline in sales compared to the 10-year average. With 4,037 sales, February saw the fewest transactions for this month since 1995, when the population was significantly smaller. New listings also fell but remained close to the historical norm, while active inventory held steady.

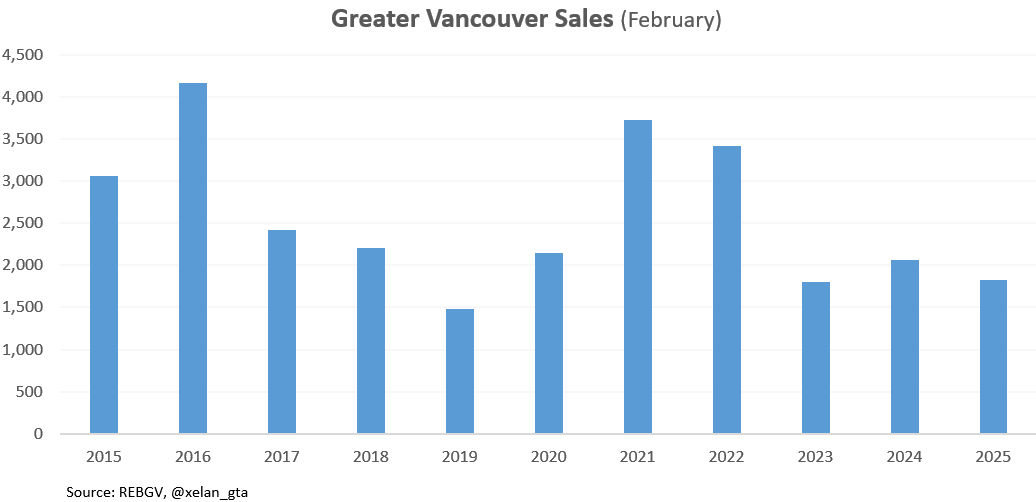
Interestingly, Vancouver did not experience the same dynamics, as February sales were low but not unprecedented. This suggests that Toronto's sales collapse was likely driven primarily by local factors, such as bad weather, rather than national or global events.
The stability of the Toronto Metro’s active inventory was largely explained by a record number of listings terminated in February.

Weak sales pushed market balance to historic lows. February’s Months of Inventory reading was the weakest since 1996 (excluding 2009), and the Sales-to-New-Listing ratio was the lowest for February since 1990.

Despite this, all price metrics increased, however, this is misleading due to seasonal effects and a higher share of luxury sales.

Seasonally adjusted Average and Benchmark prices fell, with the latter hitting a new low.

I posted this chart in the previous newsletter (link), and notably, TRREB revised previous data downward. The trend of resilience appears to have broken. Given the weak market balance readings, prices should be declining at an annual rate of 9–13% (if the market balance remains at its current level for the entire year).
Keep reading with a 7-day free trial
Subscribe to Toronto Real Estate Analytics to keep reading this post and get 7 days of free access to the full post archives.