Canada's Population Growth is Setting New Records, With New Ones Likely Ahead
Overview of important developments in the Toronto Metro housing market and macro reported in September 2022
September was an interesting month that required careful analysis. The data was sending mixed signals and depending on which metrics selected a different conclusion can be made. Here is an example of two opposing conclusions.
Positive Picture of the Current Market State
Median and Average Prices are stabilizing or even rebounding.
The share of $2M+(luxury) sales moved higher
Market Balance indicators on a seasonally adjusted basis are becoming stronger
Active Listings on a seasonally adjusted basis continue to decline and remain historically low.
Negative Picture of the Current Market State
Sales continue being low, 2008-correction level low.
Nominal market balance indicators weakened
Benchmark Price continues to decline.
Seasonally adjusted Average price declined as well in September.
Verdict
The “Positive picture” presented above looks more relevant to me however there is no certainty. I’d like to highlight, this picture is related just to the current market state and not the future outlook.
Low sales are matched with low new listings and so far sellers are able to stabilize the market. Since my goal is to provide you with early insight into risks and changing trends I’m trying to answer questions about the short-term direction:
Is the market ready to bounce back?
Should we expect market to stabilize around the current level?
Has the new leg down in the market started? (further weakening)
“Negative Picture” would point to the third option but I’m not convinced yet. It’s more likely in my view that prices in October continue being around the current level.
Right now, overall prices are down about 20% from the peak with all price metrics converging around that value. Compared to last year prices should be slightly down.
There are plenty of risks for the future outlook but today Toronto Metro is closer to a balanced market so fundamentally prices shoudn’t move much in the near term.
Condo Sector
The condo sector continues to be weaker than the overall market based on market balance indicators, however, up until now, condo prices outperformed single-family. September was the first month when condo prices finally underperformed compared to the single-family segment.
A weaker market balance should lead to weaker prices so it would be reasonable to expect condos to continue underperforming.
Condo sector relative weakness is a very important development pointing to a broad market weakness.
Rental Market
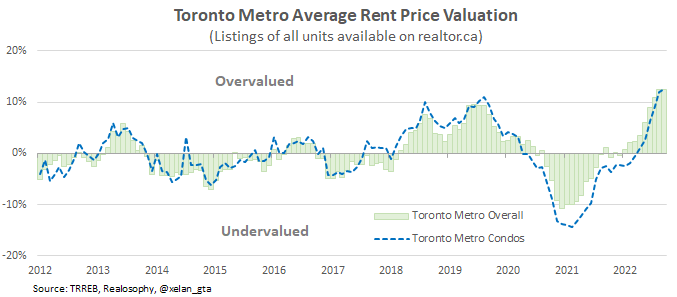
Toronto Metro Rent prices continue to rise, however, as expected at a slower pace.
The rental market entered a period of slow seasonality so if nothing changes dramatically average rent price should roughly remain where it is until the end of the year or even decline.
It’s important to note that Toronto Metro rental market is the most unaffordable since at least 2017. Based on that rent prices are estimated to be around 13% above the attainable value.
The rental market balance remains tight however there is a strong seasonality which makes it difficult to determine the exact changes.
If that seasonality is filtered out the underlying trend reveals that Toronto Metro rental market is indeed tight but actually gradually weakening for a while now. And that’s despite record-high population growth, but more on that later.
The market is always resisting high prices so while an easy case can be made for further rents affordability deterioration, the current state of the rental market is already quite unaffordable and it will naturally gravitate towards reversal to the mean. We saw similar dynamics in 2019 when the rental market started weakening despite record-high population growth at that time and typical housing completions.
Mortgage Rates
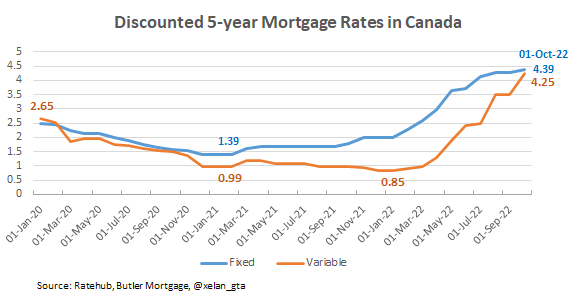
Bank of Canada raised policy rate on Sep 7th by another 0.75% to 3.25% causing the gap between the lowest available discounted fixed and variable mortgage rates to close with both converging around 4.3%.
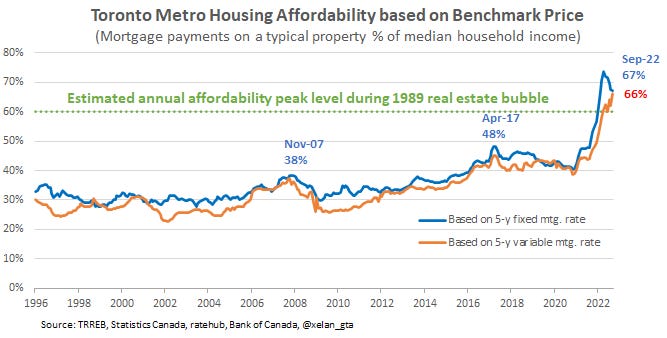
Such high mortgage rates severely impacting new homebuyers
and investors
so it’s completely understandable why sales are so low. Simply, at the current level of mortgage rates prices are still too high despite the 20% decline. Deteriorating investment attractiveness can explain condo underperformance which is the most investor-oriented segment.
Population Growth
Population growth exploded in Q2. Over the last 4 quarters over 700k population grow by over 700k (in my Twitter post i used data prior to revisions so the number came slightly below 700k). Last quarter grew at nearly 900k annualized rate after seasonal adjustment.
On a relative basis population growth slightly exceeded 1989 peak.
The primary reason behind such a significant deviation from the immigration target of 400-450k is increase in non-permanent residents which added 205k to the population growth.
All those charts are based on year-over-year data and partially masking how strong was Q2 2022.
If we focused just on that quarter we can see that the growth in non-perminent residents was significantly above historical norm.
Those who follow my work know that I highlighted record inputs into population growth in 2022 on many occasions. The question is if those inputs can really explain 100k increase in non-permenent residents over the next highest value?
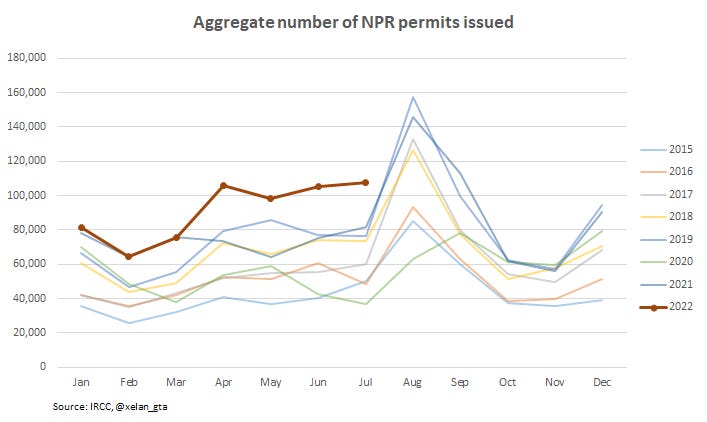
I believe they can. Here is how aggregated data looks for all new permits issued to non-permanent residents.
As you can see, in Q1 permits were closely trailing 2021, however starting from April, aggregate number of new permits was higher every single month. If we sum up all permits for Q2 and compare to the second highest year 2021, the difference will come down to 101k.
Population growth in Q3 2022
If my analysis is correct and strong growth in permits is leading to a boost in non-permanent residents then we may see a strong population growth in Q3 as well, further boosting year-over-year value. Aggregate permits data for July(as shown on the chart above) is also exceeding all previous years. August data will be crucial to watch.
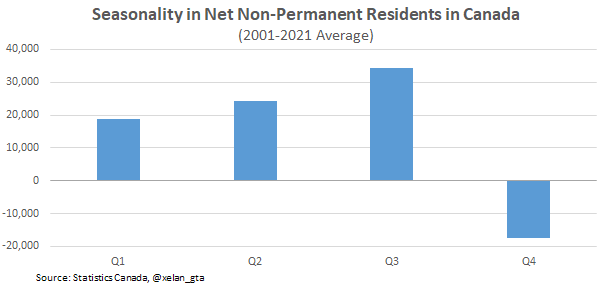
Another reason to expect strong growth in Q3 is related to seasonality. Traditionally Q3 is the strongest quarter for non-permanent residents growth.
Post-Graduate Work permit extension announced in Aug 2 (link) should slow down the outflow of non-permanent residents, boosting population growth in the second half of this year. Existing study permit delays (link) may push student arrivals toward the end of the year providing a population boost in Q4. Up to 1,200 new IRCC employees will be hired by the end of the fall(link) to tackle all kinds of immigration backlogs.
Lastly, if we look at Q3 and Q4 of 2021, those weren’t strong quarters historically speaking.
That means that even modest population growth in Q3 and Q4 2022 will boost year-over-year population growth value.
A headwind to the population growth in Q3 and Q4 could be immigration. It was running so strong in Q1 and Q2 so 53% of 432k annual target was fulfilled. Unless Canada is going to exceed immigration target, the pace of PR admissions should slow down at a tune of 15k per quarter in both Q3 and Q4 compared to the first half of the year.
After statistics for August are released it will be possible to tell with great certainty how population growth data in Q3 will look like, however even now, further year-over-year increase is very likely.
Updated immigration targets for 2023-2025 should be finalized by November 1st. Low unemployment, accumulated pool of post-graduate permit holder due to extensions and high current CRS score(overall quality of new immigrants) will likely lead to further increase in immigration targets. Housing shortages were never priority of the politicians so it shouldn’t be a surprise if they are continue to be ignored.


