


Toronto’s Active Listings Surpass 30,000 for the First Time Since 1995
Overview of important developments in the Toronto Metro housing market and macro reported in May 2025


Highlights
Toronto Metro’s active listings continued to rise despite a high terminations and an uptick in sales activity.
The rental market is softening, however, not all data sources align.
How do Toronto rents compare to the rest of Canada?
Three key trends are expected to significantly reduce Canada’s population growth in 2025. The target is estimated by the model.
Who feels more financial pressure: Renters or Homeowners?
Unemployment and mortgage arrears are on the rise.
The Canadian economy is facing challenges in Q2-Q3 2025.
Real Estate Market
In May, there was a shift in the Toronto Metro’s real estate market, with sales, new listings, and active inventory all rising compared to the 10-year average.

This chart uses the new methodology introduced to address the issue highlighted in the previous newsletter (link). The number of new listings in May was the second-highest for that month since at least 1980, surpassed only by 2017. At the same time, listing terminations rose to their highest point since 1992, suggesting a significant amount of listing recycling. Despite that, active inventory continued to climb, surpassing 30,000 listings and reaching the highest levels since 1995. May typically marks the seasonal peak. Importantly, when adjusted for population growth, the current level of active inventory is still 31% lower than the 2008 peak.

Inventory, sales, and new listings all influence market balance, which improved slightly compared to the 10-year average but remained generally weak. The condo sector continued to underperform relative to the broader market.

Prices held steady, with most price metrics posting modest gains in May, largely due to seasonal factors and a reduced share of condo sales.
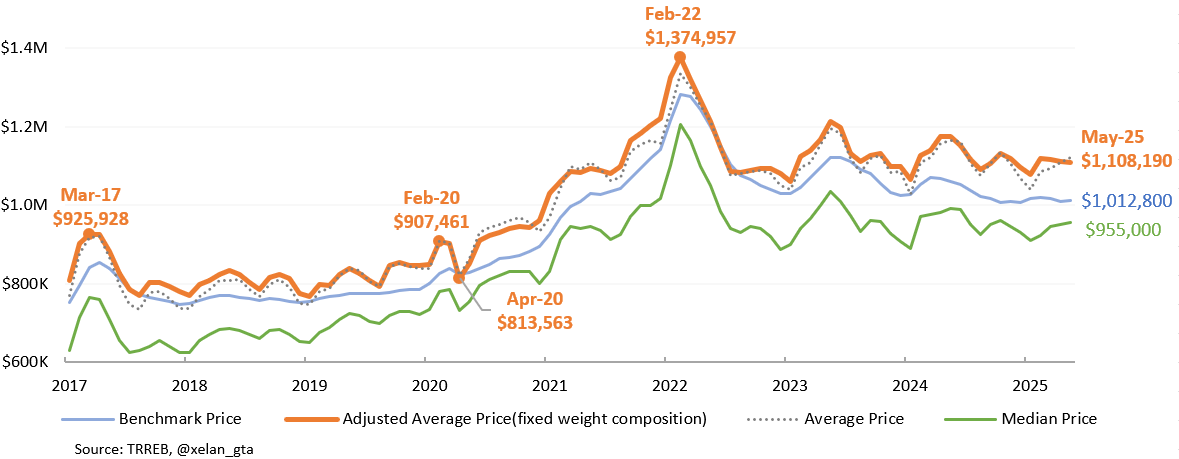
Last month, I highlighted changes related to the Toronto Regional Real Estate Board reporting (link). It’s now possible to compare the old data with the revised figures. The revisions are significant, for example, here’s how the seasonally adjusted benchmark price changed:

In this report and future releases, I’ll be using data based on the new methodology.
Rental Market
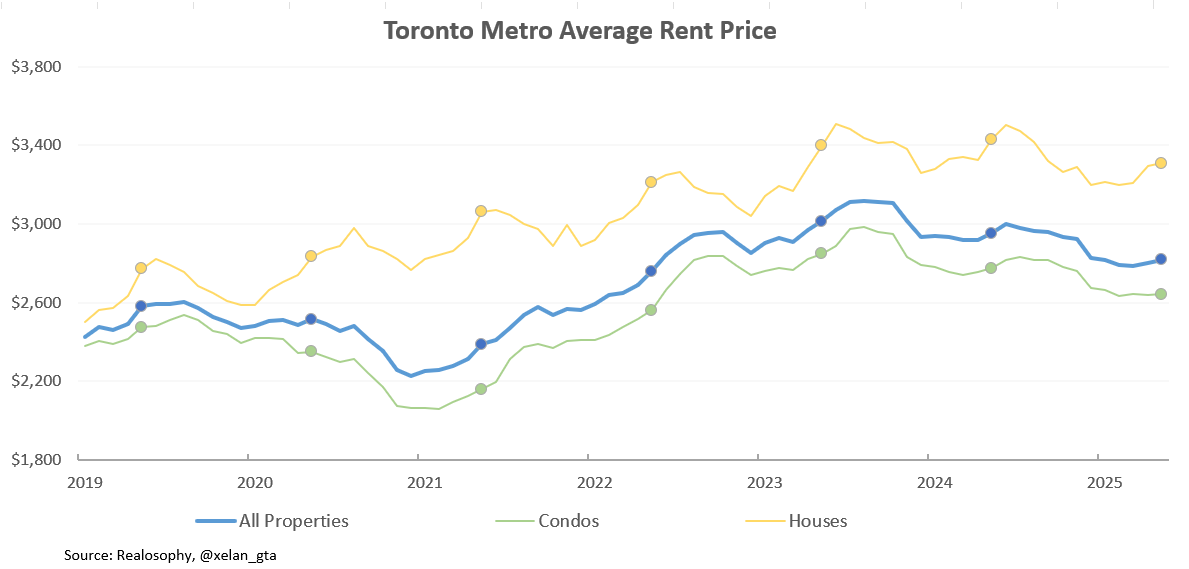
Toronto Metro’s rental market weakened in May, with the market balance falling further below the 10-year average.

Rent prices increased, largely driven by seasonal strength in low-rise house rentals. This trend typically peaks by August, so a few more months of relative strength would not be surprising.
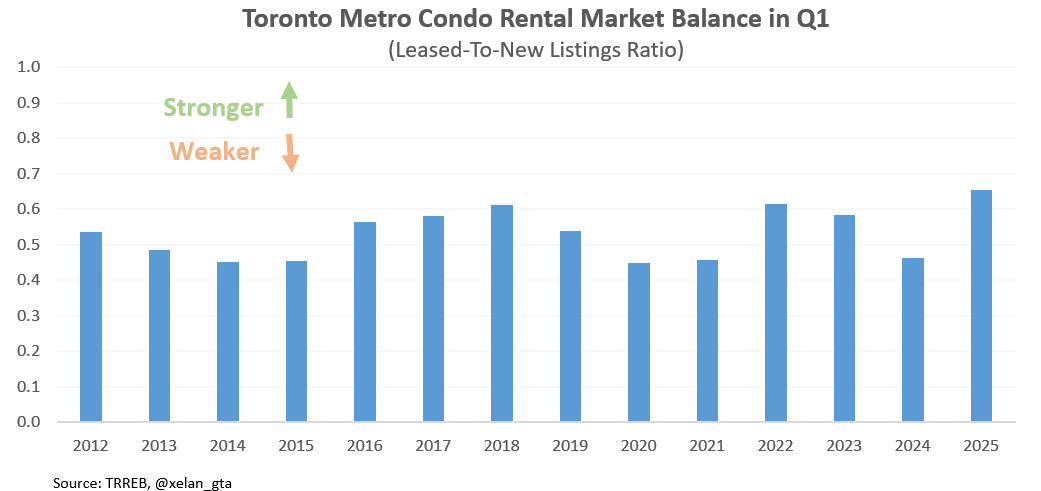
Recent data from the Toronto Regional Real Estate Board revealed some interesting trends in the condo rental market. In Q1 2025, the number of leased condo units reached its highest level since at least 2012. This growth in leasing activity continues despite slower population growth.

Meanwhile, new condo rental listings declined in Q1, tightening the market. As a result, the latest market balance reading was the strongest for that quarter since at least 2012.
Keep reading with a 7-day free trial
Subscribe to Toronto Real Estate Analytics to keep reading this post and get 7 days of free access to the full post archives.