


The Market has Turned on a Dime
Overview of important developments in the Toronto Metro housing market and macro reported in April 2022


Toronto Metro real estate market did it for the 3rd time since 2016 - it weakened very rapidly within a couple of months. You probably heard that due to exceptionally low inventory and market tightness at the beginning of this year it would take a very long time for Toronto to return to a balanced market. In my January newsletter, I was warning against such logic.

Nothing is surprising about the speed of the market shift, we saw it in 2017 and 2020, and now we are seeing it in 2022 so let’s dive in to see what the market looks like today.
Resale Market
New listings continue to be added at a healthy pace but sales are declining rapidly, falling in April by -39% on a seasonally adjusted basis compared to February 2022 and declining below the 10-year average.
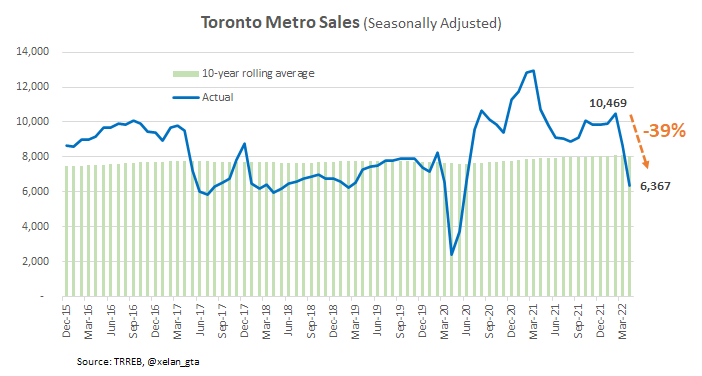
That results in the accumulation of the active resale inventory which is still historically low but rising rapidly, more than doubling on a seasonally adjusted basis since the December lows.

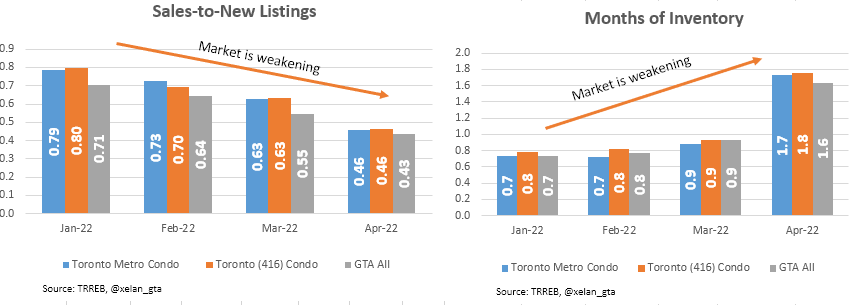
Both market balance indicators continued to weaken in April with Months of Inventory1 remaining in the Seller’s Market but Sales-to-New Listings2 already moving into a Buyer’s Market Zone.
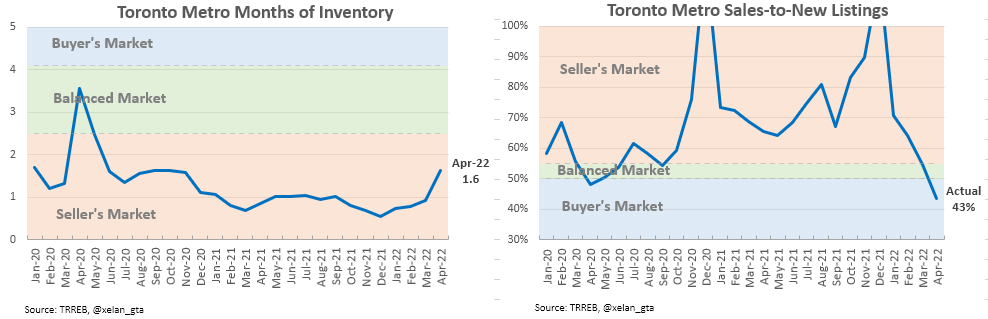
For more perspective, Sales-to-New Listings reading like we are seeing today only happened two times since 2006, both of which were around housing correction episodes.

It means that a lot of new listings are being added and few sales happening which should lead to further active inventory accumulation and weakening of the second market balance indicator - Months of Inventory. In some sense, Sales-to-New Listings is a leading indicator.
All price metrics showed a broad market price decline in April and are currently down from the peaks.
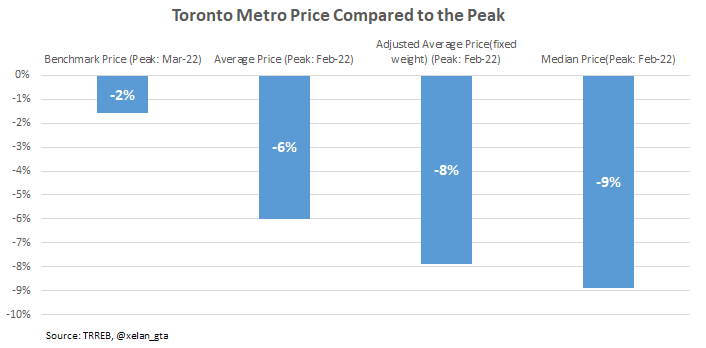
Important to remember about the lagging effect of the Benchmark Price3 which I described here. April’s data clearly demonstrated that.

Benchmark price is declining month-over-month at a rate last seen in 2017 so it’s not an ordinary event.

The market should continue slowing down in the near term based on the market balance indicators and further price declines are expected.
Despite the market slowdown and price declines housing affordability4 worsened further in April due to the rising mortgage rates, setting a new record. I literally have to update the scale on this chart every month recently.

That being said, given the current market dynamics and macro environment I feel this could be the peak for the affordability metric or very close to it. Reversal makes sense but the questions remain about how it’s going to be achieved and how big of a pullback we are going to see. Affordability is very far from the long-term average indicating that today’s prices are about twice as high compared to the norm given the current level of mortgage rates.
Why prices are declining with a tight market balance?
How is it possible that the market has turned with the Month of Inventory below 2 which is considered a Seller’s market? I believe 2017 provides a clue here. During the rapid market changes like today, a lot of people are getting caught off guard. For example, when they already bought a new house and now need to sell an existing one. With the market working against them such sellers desperately need to sell, that’s what causing the initial price declines we are seeing.
So strictly speaking, prices are declining today because of some temporary factors which should disappear within a couple of months. However, while it’s happening market balance is weakening as well and if it weakens significantly enough it will fundamentally support further price declines.
In any case, for now, time is working against the sellers who would like to sell but waiting on the sidelines for additional data.
Important note: Most of my analysis is done at the metro level. Different neighborhoods and housing segments may perform differently therefore contact your Real Estate agent to get the most accurate data for your area.
Rental Market
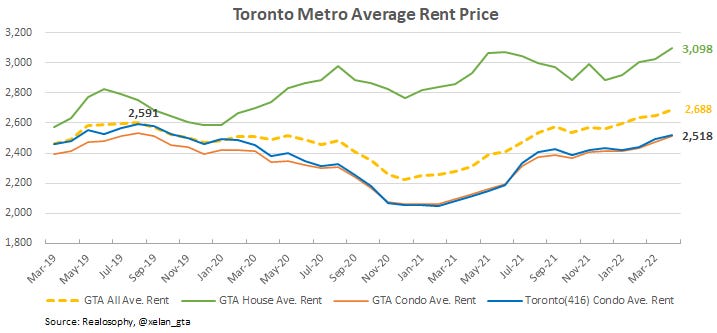
Toronto Metro rental market continues to be strong and rent prices are rising. However, the growth remains uneven with single-family rentals pulling the average up.
It’s important to remember that the rental market is seasonal and currently we are in the midst of strong seasonality.
The rental inventory is declining, approaching the historical average.

Rental Market Balance remains a record tight but it’s very close to the one seen in 2017 and following a seasonal pattern so it remains strong but not really getting either stronger or weaker.

It is expected that rent prices continue to grow in the near future.
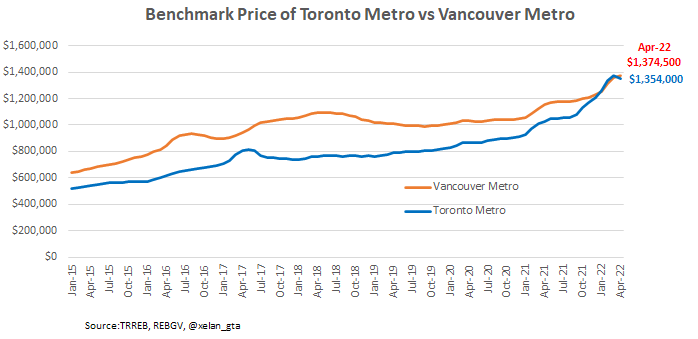
Vancouver Metro is back to being #1
Toronto Metro enjoyed being the most expensive metro market in Canada for 3 consecutive months but that ended in April.
Condo Sector
The condo sector was a dark horse throughout the whole pandemic. It was “beaten” at the beginning but then recovered and was getting ready for its prime time at the end of the pandemic when everyone is back in offices and pent-up travel consumes housing stock for tourists’ accommodation.
Before that happened mortgage rates increased and the market entered a slowdown. So what’s in store for the condo sector then?
For now, market balance indicators for the condo sector are moving in line with the broad market.
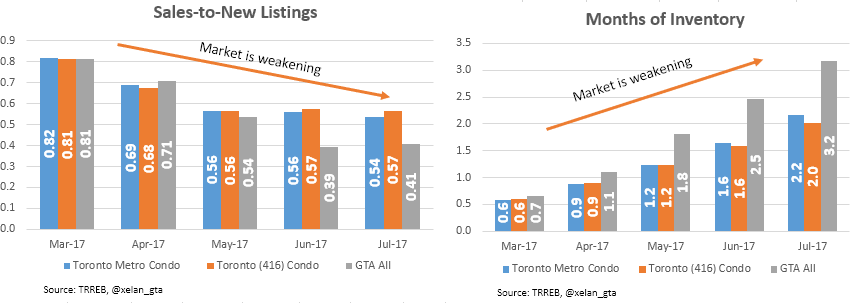
In 2017-2018 when interest rates were rising buyers shifted to the condo sector because it was more affordable and if we check how market dynamics changed during the 2017 market slowdown, we can see that, unlike today, the condo sector was holding up much better than the overall market.
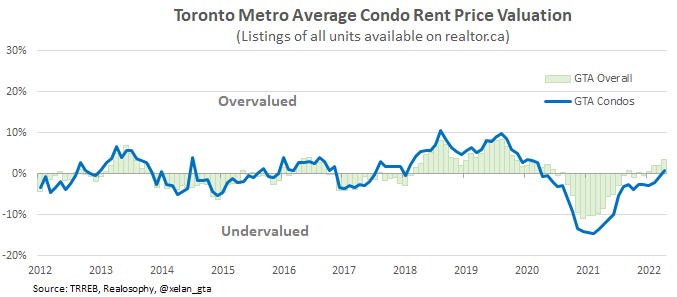
The rental market represents an upside potential for rents at the moment but the question is how much of that potential exists and is it sustainable? My estimate shows that Toronto Metro condo rents are fairly valued at the moment.
A decline in the resale market may create additional demand for rentals serving as a tailwind. Another tailwind could be related to the immigration levels increase this year and temporary resident programs for Ukrainians. The downside risk would be a rise in unemployment. Overall, short-term risks for Toronto Metro condo rents are tilted to the upside.
Rising mortgage rates and bond yields are affecting condo investment math in a major way. I changed my methodology for cash flows calculation to include the latest available 5-year fixed mortgage rate and it showed that in April estimated condo cash flows went negative even after principal payment recapture.

As of May 4th, 2022 US 10-year bond yield was above 3% which exceeds the cap rates for many Toronto condos - a riskier investment. Normally riskier investments should provide better returns to get investors interested.
Here is an example of investment calculation math for one of the Toronto condo listings (selected randomly).

Despite the usage of a conservative 3% mortgage rate and 30 years amortization, an investment like this makes no sense to me in the current environment without some optimistic assumptions about the future. (If you can justify it without any speculative assumptions please reach out to me, I’ll be very interested to read your justification and probably learn something I don’t know or missing.)
Another challenge is related to the pre-construction segment where investors who have units completed this year are facing higher mortgage rates and negative cash flows they likely weren’t expecting.
For those reasons I’m not sure if the condo sector will attract as many buyers as it did in 2017-2018. It would be very important to monitor demand going forward because it may provide a clue about the whole market slowdown. A shift of the buyers from the single-family segment to condos would be expected if long-term expectations are optimistic. However, if demand is going to continue to leave all segments equally - that could indicate a significant deterioration in the broad market sentiment - something, we haven’t seen even in 2017.
Bond Market
Correction of the bond markets is at the center of macro discussions today.
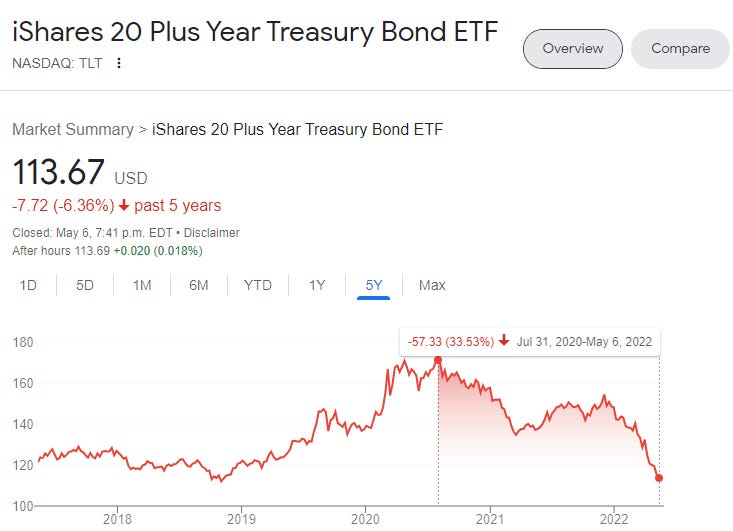
It is also quite an extraordinary event
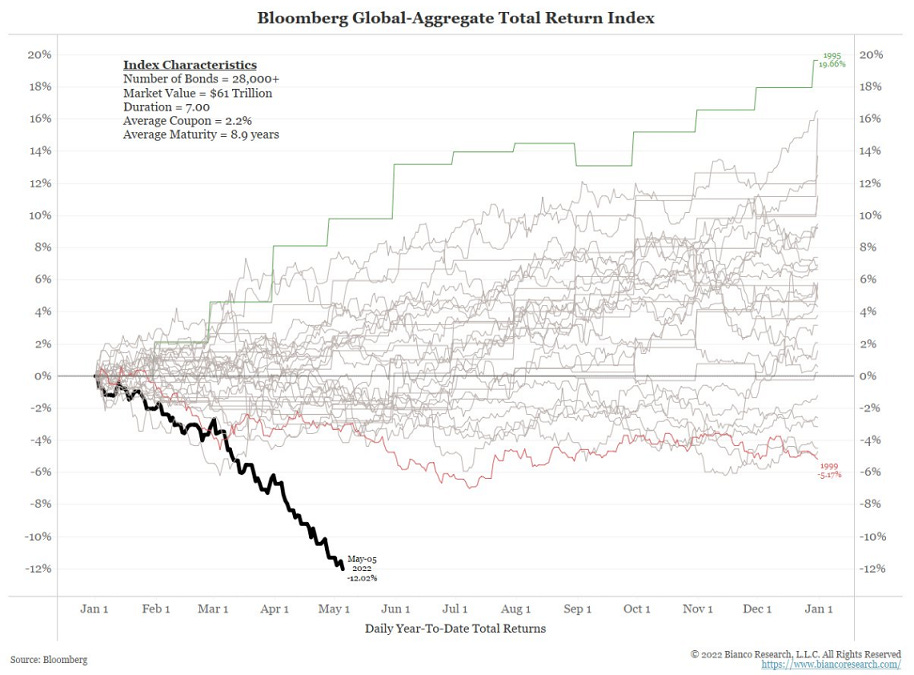
This is important because all asset classes are usually priced based on bond yields. I’m nowhere near a macro expert, especially during such times so I would encourage you to study expert opinions and don’t rely just on my views. As I’m researching this topic, I’m happy to share my findings, especially those which may have a direct impact on the real estate outlook.
Is the bond market a bubble? How big of a bubble it is? What are the fundamentals to estimate correction potential? There is no consensus on the answers to those questions and it’s understandable because in order to price a 10-year bond today you need to guess inflation for the next 10 years which is an extremely difficult task to do.
Instead of speculating, I’m going to just base my view on the assumption that inflation will return to 2% within the next 3 years. This is central bankers’ job and I believe they’ll do it even if it’s going to damage the economy. The Bank of Canada is simply not allowed to run inflation outside of the 1%-3% range based on its own framework.

If that view turns out to be correct here is what bond market returns are going to look like.

When people are saying the bond market is a huge bubble today based on 40-year performance, they assume that the bond market was fairly valued back in the 1980s. My analysis shows that it’s not the case, in the early 1980s bond market was very undervalued and represented a great buying opportunity providing investors with an average 10% real return for the next 10 years.
The bubble was in the 1970s, when investors severely mispriced future inflation and, as a result, significantly overpaid for bonds. Was there a bubble in 2020? I guess you can call it that but the scale was relatively small (again, assuming my inflation projection is correct). In my view, today's bond market declines are explained by repricing inflation expectations but mainly, by the market adjustment to the new reality where central banks are switching from injecting capital into the bond markets(QE) to actually pulling it away(QT) so real yields5 are moving back towards a positive territory, where those should’ve always been.
How does that feed into real estate? The low bond yields we saw between 2011-2020 are likely not coming back on a permanent basis. It’s also unreasonable in my view to expect long-term bond yields to significantly rise above the current levels.
The historical average for real 10-year bond yield is around 1% so that’s where I believe the bond market should settle eventually, even though a temporary overshoot is likely until inflation is taken under control.
Based on that view, discounted 5-year fixed mortgage rate of 4% looks appropriate and represents a “new normal” rather than anomaly. It may go up and down with business cycles but should gravitate towards 4%.
That level of mortgage rates will require repricing of the Toronto Metro market to retain affordability for homebuyers and attractiveness for investors. Here is a table I created that helps to estimate the repricing depending on the mortgage rate change. To clarify, the numbers presented here will just compensate for higher mortgage rates but won’t result in improved affordability.

For example, at the beginning of 2022 discounted variable mortgage rate was 1%. If it rises to 3% prices should decline by about 20% to retain the same housing affordability(same mortgage payments for homebuyers) as it was at the beginning of the year.
Repricing of this scale can be very damaging to the economy so in my view we’ll see lower interest rates and bond yields within the next few years, but it will be a just temporary relief. Inflationary forces are here to stay so central bankers will continue to be forced to damage the economy bit by bit until the economy and asset classes are fully adjusted to the new higher bond yields environment.
Immigration and Population growth
Inputs into 2022 population growth in Canada started on a very strong footing. Immigration is running at around 460k annualized rate which should be enough to clear the 2022 target of 432k.

A record amount of new study permits were issued in the first two months of 2022.

That should serve as a tailwind for the housing market especially taking into account there is no planning for the growth of international students, so no new supply is being built or allocated for it.
Some people believe that strong immigration is the ultimate bull case for the housing market, but I would warn against such a view for several reasons:
Affordability can’t be ignored and the data clearly shows that more people are leaving Toronto Metro in response to the housing affordability challenges. It will be even more challenging to settle here for new immigrants.
Overbuilding/Underbuilding is an extremely complex topic and measurement depends on many variables. Those variables can change drastically and like the current resale market shift in Toronto, the existing shortages of housing can turn into a surplus quite rapidly. (Overbuilding risks studies for all major markets across Canada are available for a fee).
Just to give an example, during the pandemic Toronto Metro market turned from one of the tightest markets to a very oversupplied one in a matter of months.

Rental vacancies spiked to record-high levels. While conditions created during the pandemic are unique other scenarios exist that may lead to the supply/demand shift in the market.

Immigration is a very important fundamental for the housing market but it’s just one part of the full picture.
Conclusions
Toronto Metro real estate market continued to weaken in April with prices declining across all price metrics. I shared my detailed view on the market slowdown (link) and important indicators I’m watching to determine what kind of correction is unfolding in front of our eyes.
Sales pullback was an important milestone indicating a broad market acceptance of the slowdown and future price expectations downgrade. The correction will likely continue with more listings accumulation and further sales pullback.
Prices decline of 15-20% (if it happens) will be an important milestone where historically market stabilized, at least temporarily. That’s also a threshold where policymakers and politicians usually start paying close attention to the market and potentially intervene.
Toronto Metro Rental market is very strong, and the market balance is tight but stable. Rents are growing and expected to continue to do so in the near future supported by the market balance and seasonality. Overall, risks for the rental market are tilted to the upside.
Inputs into population growth such as immigration and new study permits started 2022 on a very strong note. A record amount of new study permits were issued during the first two months.
Bond market correction is one of the central topics of the macro environment. In my view, the bond market is returning to its fair value. The long-term average for a 10-year real bond yield is around 1%. If the current shift is permanent then all cash-generating asset classes including Toronto Metro real estate will need to be repriced to restore risk premiums compared to bond yields.
Bank of Canada is fully aware of the negative impact of higher mortgage rates on housing, they are expecting an uptick in insolvencies:
“We know that rising rates are going to put pressure on borrowers and in particular on people who have stretched their borrowing capacity to get into the housing market but inflation is putting pressure on all Canadians. We need higher rates to moderate demand including demand in the housing market.” - Carolyn Rogers, Bank of Canada, May 3, 2022 (link, 38:50)
And moderation in the housing prices:
“Housing price growth is unsustainably strong in Canada it would not be a bad thing for the economy, for the growth in housing prices to moderate a bit and we do expect it to happen as the rates go up, it needs to happen.” - Carolyn Rogers, Bank of Canada, May 3, 2022 (link, 38:50)
So the housing market is slowing, it is slowing by design and it’s expected to continue slowing in the near future. At the same time, global financial markets are struggling and recession risks are rising. While inflation is still elevated the hands of the central banks remain tied so no monetary policy support can be used until inflationary pressures recede.
Months of Inventory shows how many months are required to absorb current active inventory at a current level of monthly sales. The lower the value, the stronger the market.
Sales-to-New Listings measures market balance by comparing the number of sales within the last month to the number of new listings during the same period. The higher the value, the stronger the market.
Housing Affordability is defined as the share of median household income required to be spent on mortgage payments when buying a typical property. Mortgage payment is calculated using discounted 5-year fixed mortgage rate and 20% down payment. The higher the value - the more unaffordable the market is for homebuyers.
Real means adjusted for inflation.