


Real Estate Market is Stable While the Most Restrictive Tightening Cycle in 30 Years is Playing Out
Overview of important developments in the Toronto Metro housing market and macro reported in November 2022


Coverage of the Toronto Metro Real Estate market is becoming boring. I don’t see any significant shifts, the market continues to hover around the balanced state. Low active inventory is preventing further decline in prices.
The best visual here in my view would be a comparison of some key metrics to the previous housing downturns.

The charts show that market balance indicators - Months of Inventory and Sales-to-New Listings didn’t change much for the last several months. They are hovering around the balanced market zone which explains the price stability observed during those months. Active inventory is noticeably low compared to the previous housing corrections, especially if we add data for the housing crash of the late 80s and take into account population growth since then.

Right now it’s kind of a waiting game to see what’s going to happen first: mortgage rates decline/lending rules change to bring more buyers back or sellers start listing their properties due to the mounting financial pressure. Sales are unsustainably low, and so are the active listings, something has to give.
Macro data helps to provide some clues here. It is known that interest rate changes usually take 18-24 months to have their full impact (link) so it’s very early in my view to make any conclusions about the economy or housing market 1-2 years down the road.
Especially it’s important to remember about this lag because the current tightening cycle is the fastest and also the largest(if adjusted for the debt levels) since the 90s.

It’s not uncommon for regular tightening cycles to cause recessions let alone the current one which is intentionally more restrictive than the previous ones. The depth of the yield curve inversion shows how restrictive indeed it is. The latest value on the chart is the lowest since at least 1992.

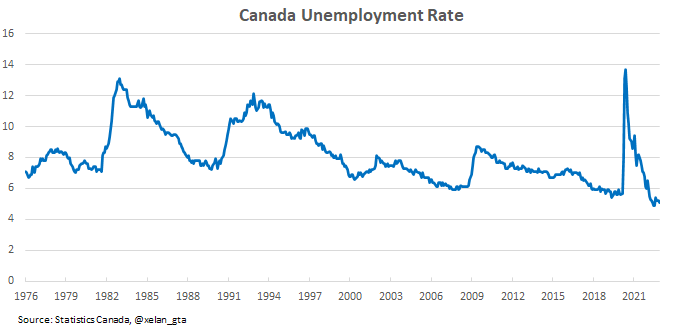
So while there are plenty of potential risks in the future today’s data looks pretty good.
Unemployment is low.
Household savings rate is declining but still among the highest within the last 30 years.

Consumer insolvencies, while higher compared to the previous year, are still below the pre-pandemic level.

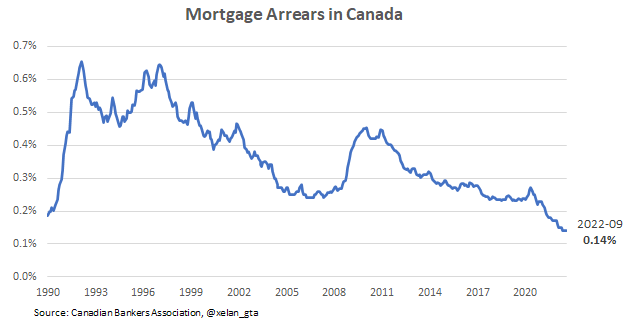
Mortgage Arrears are the lowest since at least 1990.
Non-mortgage household debt is growing rapidly but so far it barely exceeded the pre-pandemic level and that doesn’t account for population growth during that time.

There are plenty of future risks some of which I highlighted in my previous newsletter “Financial pressures are mounting due to rising rates” (link) but today major macro indicators are looking pretty good.
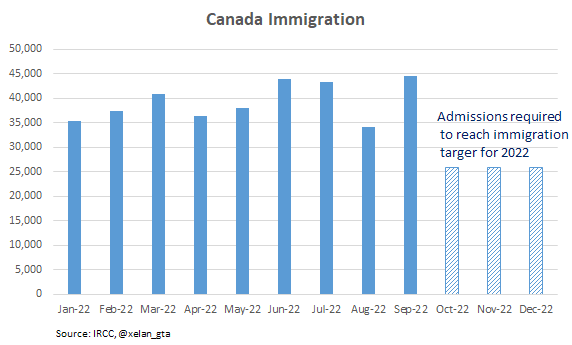
Population growth is one of the key Canadian metrics I’m following very closely. The latest data remains exceptionally strong.
Canada is admitting permanent residents so fast that we are on a course to exceed the immigration target of 431,645 unless admissions slow down during the final quarter. Here is how those admissions should look on average to land exactly on target for 2022.
The aggregate number of non-permanent resident permits in 2022 continues to exceed all previous observed years

so we may see an additional 100k population growth boost in Q3 from non-permanent residents. If you think 700k+ year-over-year population growth in Q2 2022 was a lot, wait for Q3 data.
It is important to note that despite such strong population growth rental market in Toronto Metro started stabilizing, and even showing seasonal rent price declines. It’s still a tight market but not as tight as it was earlier this year.

Conclusion
Toronto Metro real estate market remains balanced. Sales continue to decline which is offset by the low inventory. Prices already declined by 20% from the peak and sellers simply don’t want to sell at a discount into a weak market and prefer to wait it out.
Meanwhile to contain inflation central banks are implementing the most restrictive monetary tightening in at least the last 30 years. Rising interest rates create financial pressure for property owners and the key question is how long they can handle it. Despite obvious signs of distress in some segments like private mortgage space, there are no signs of any significant uptick in new listings so those cases remain limited for now.
Major macro indicators look good, however, it’s really important to focus right now on how the most vulnerable property owners are doing. How much savings and equity do they have? What’s their monthly cash flow situation? Unfortunately, this analysis is very complex and goes beyond the scope of this newsletter. Also, it’s important to remember that monetary policy changes take time to have a full impact, usually 18-24 months.
Population growth in Canada continues to be exceptionally strong. Immigration is on track to exceed the 2022 target unless the pace slows down. The number of permits issued for non-permanent residents in Canada continues to be record high setting expectations for a strong population growth reading in Q3 2022.
Jan 22, 2023 update: The chart for Canada Yield Curve Inversion was updated to match the label.