


Sellers are Pushing Inventory Up but the Market is Holding Up for Now
Overview of important developments in the Toronto Metro housing market and macro reported in March 2022.


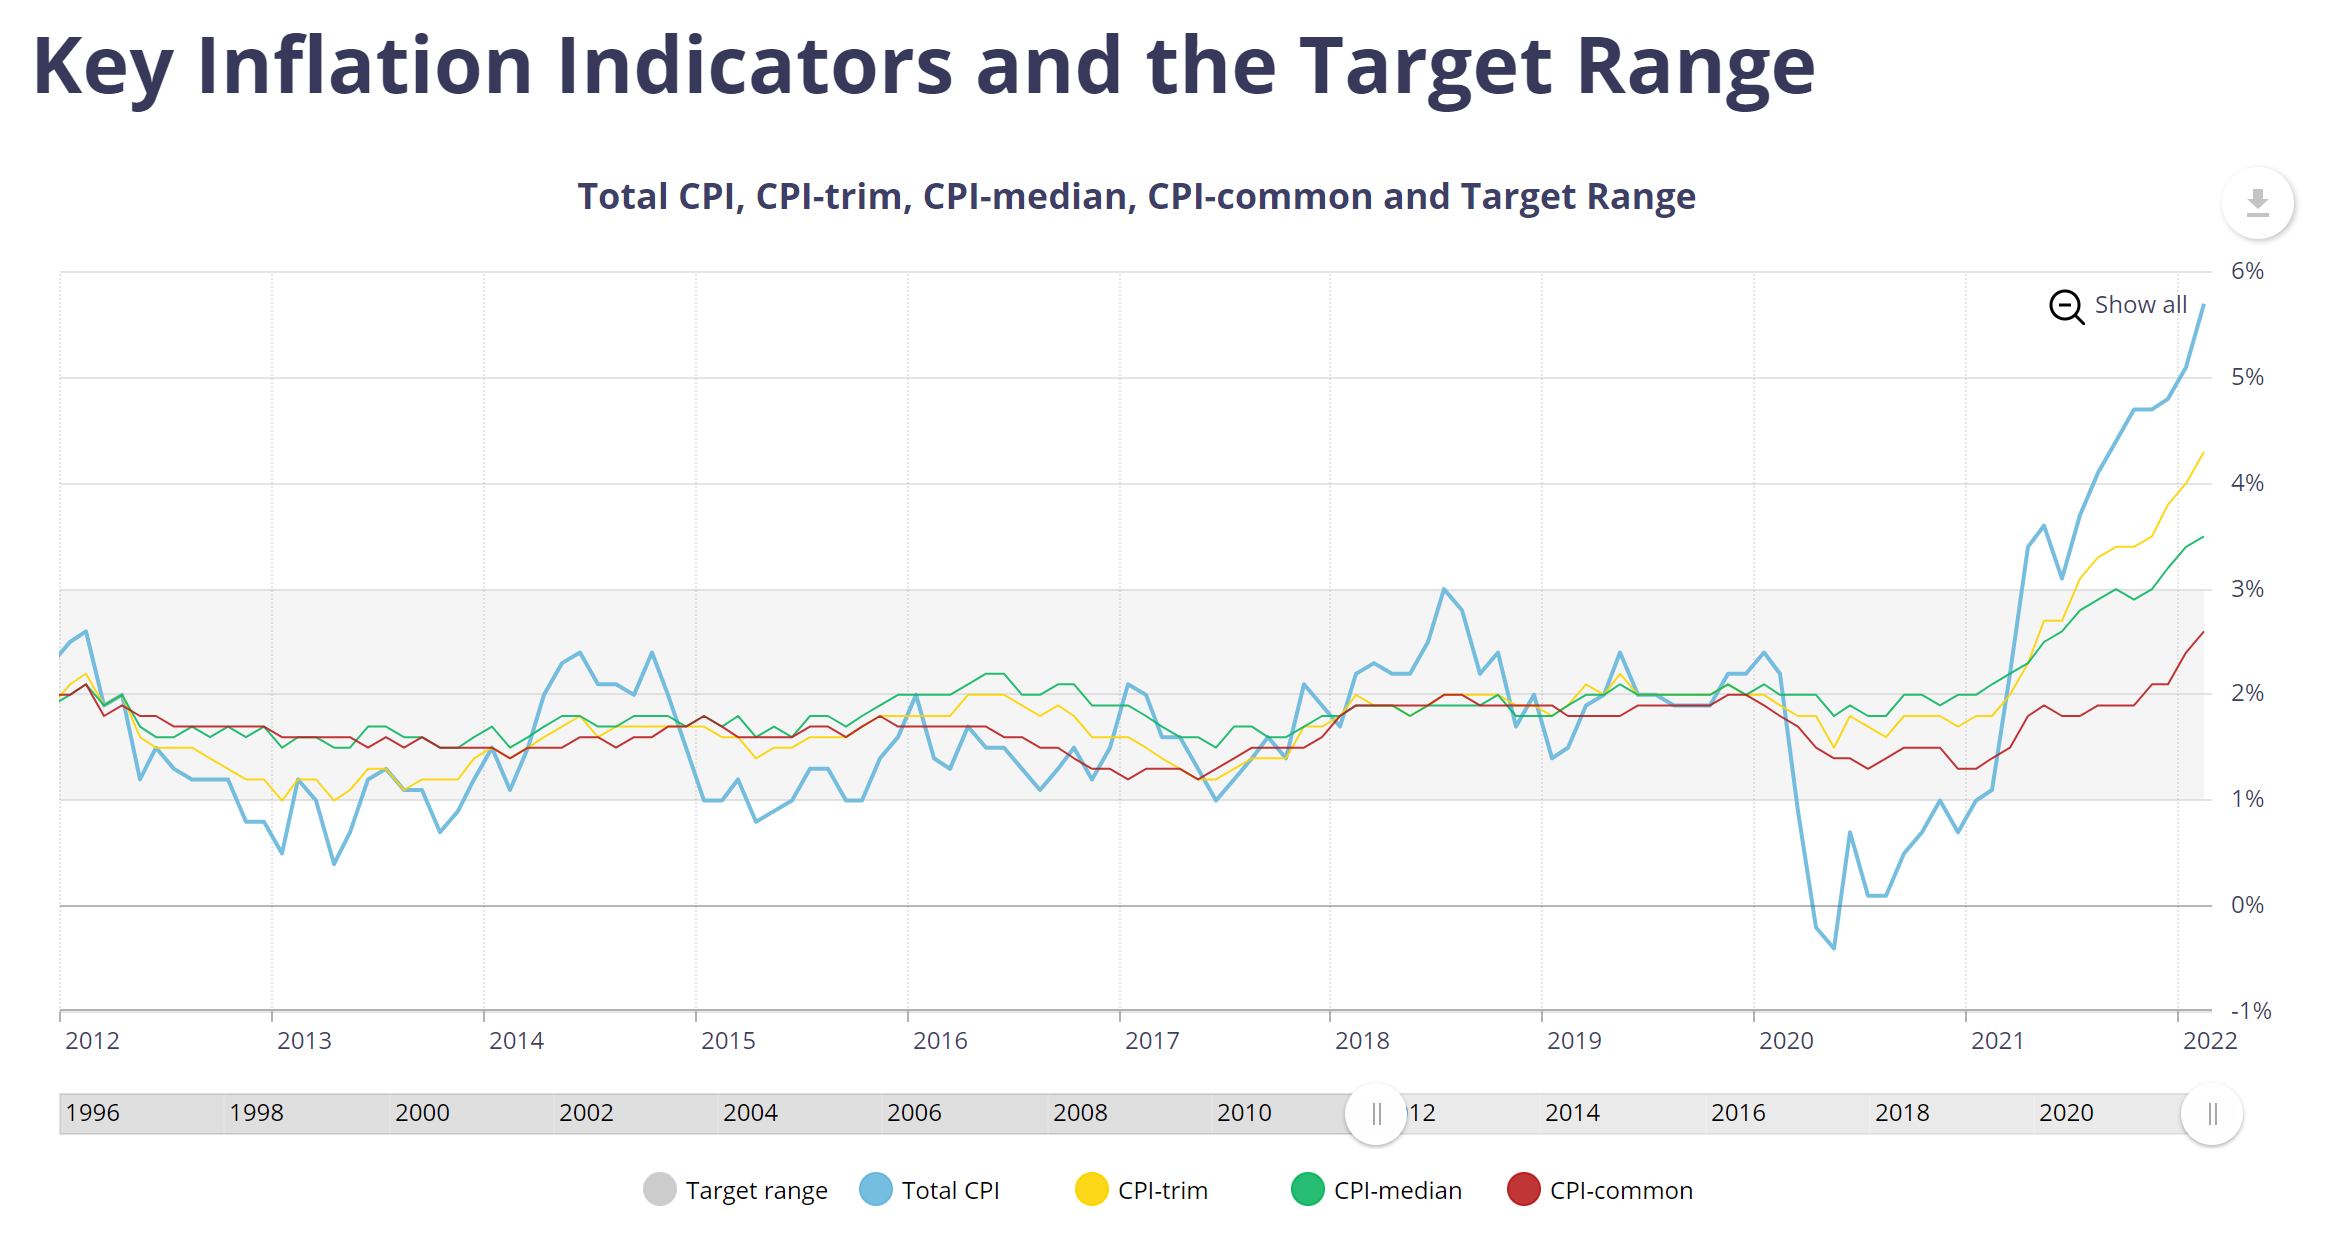
In March, the Bank of Canada increased policy rate by 0.25% for the first time since 2018. The bond market also tightened. Both of those events resulted in higher both fixed and variable mortgage rates.

The gap between fixed and variable rates is significant(1.68%) but it’s expected to shrink in April, after the next interest rate decision.


The reason for tightening of both monetary policy and the bond market is exceptionally high inflation which remains higher and lasts longer than previously anticipated feeding into futrue inflation expectations.
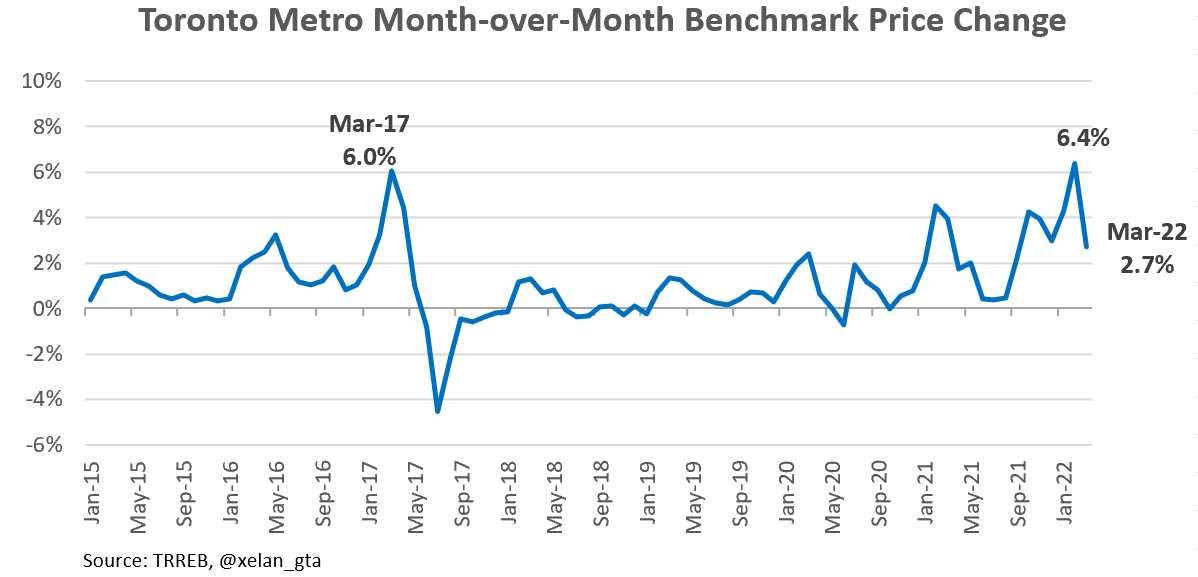
Toronto Metro Benchmark1 price continued to rise in March but the pace slowed down from 6.4% to 2.7% month-over-month.
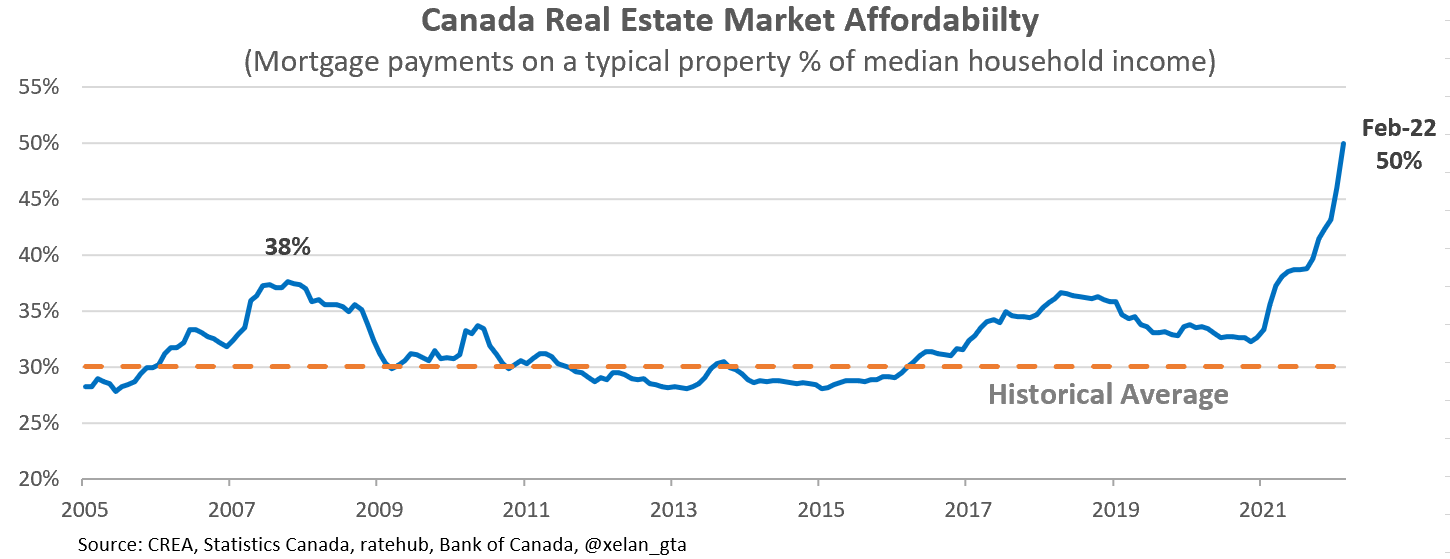
As a result of mortgage rates and real estate prices growth, Toronto Metro housing affordability2 continued to worsen to an unprecedented level. The affordability level in March was more than double the long-term average. Switching to a variable mortgage rate improves things a little.

It’s 64% more difficult now to carry a mortgage on the same property compared to the pre-pandemic and 75% compared to the pandemic lows. When people say mortgage payments doubled on the same property they are not far from reality.
This is hardly sustainable and justifiable in my opinion and part of the market(sellers) are starting to agree with that point of view. There is a significant increase in new listings leading to the continued rise in active inventory.

It is still historically low, but rising rapidly, much faster than the seasonal pattern.

However, another part of the market (buyers) disagree and sales in March were still strong at around 115k annualized level which is about 20% above the 5 and 10-year averages.
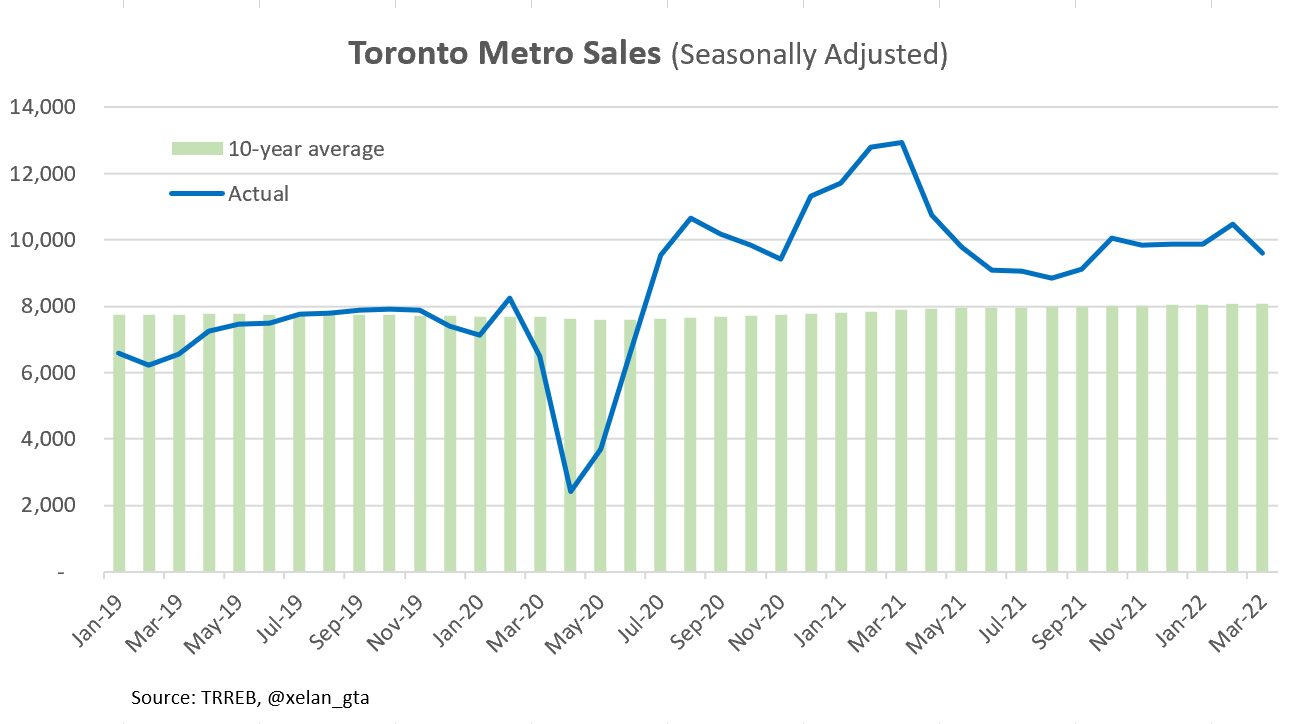
I believe mortgage pre-approvals locked in at lower rates could be a factor here so within a couple of months we should get an idea of where sales stabilize. In the light of rising mortgage rates, I just can’t see the current level of sales being sustainable but the buyers are clearly optimistic, whether it’s driven by fear or rational calculations.
Aside from active inventory, sellers are further pushing the market towards a balanced territory by adding more supply. Months of Inventory3 is rising but still very deep in the Seller’s Market territory, Sales-to-New Listing4 is already declined to the Balanced Market one. That means the opportunity to sell at peak prices could be closing very rapidly (if not closed already).

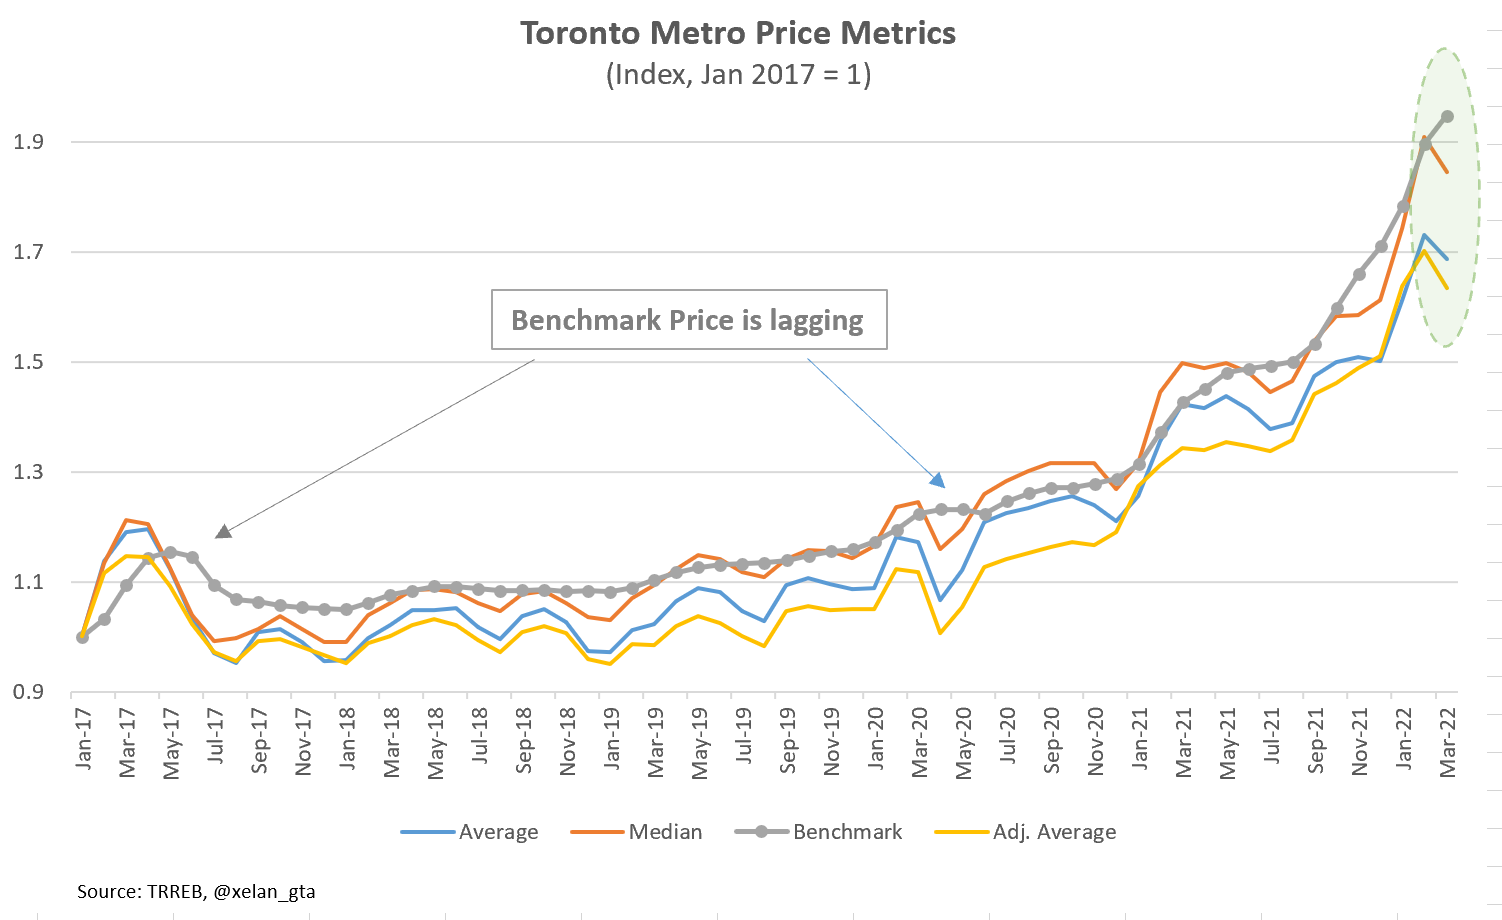
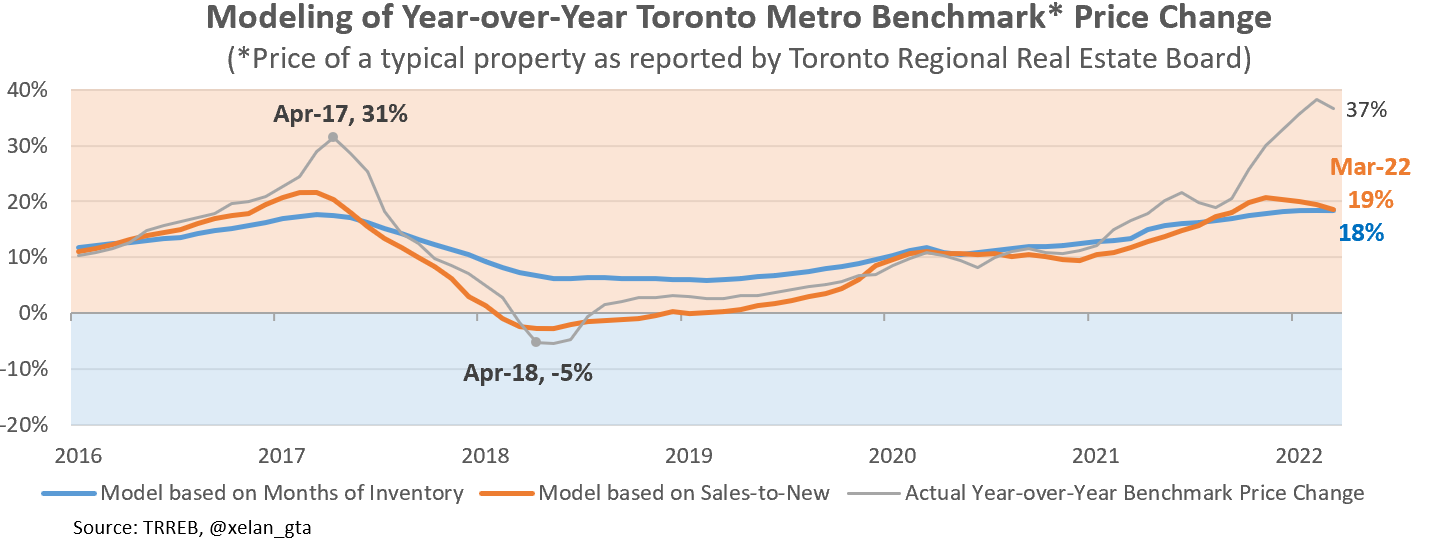
Speaking about the prices, I need to clarify an important point. Benchmark Price is designed to reflect actual price movements in the market and overall it’s doing its job, but it has an important flaw - it’s lagging. Other price metrics such as Average and Median prices don’t reflect actual market price movements and are easily skewed by various factors such as seasonality, size, quality, and composition of the sold units. The benefit - those metrics don’t have a lag and calculation is simple which excludes any modeling errors. I have a mathematical proof of the Benchmark Price lag, but here is the visual where you can see it with a naked eye.
The reason why I’m going so deep into the technical aspects is that when the market is evolving predictably, benchmark price overall has a preference. However, when the market is changing very rapidly(like today) it’s very important to remember that benchmark price is a lagging metric so it doesn’t reflect the real-time picture correctly. The reality is in such a market, there is no single reliable metric that will tell you how prices are really changing overall (at least I don’t know any).
You can see on the price metrics chart that in March 2022 both Average and Median prices declined but benchmark price increased compared to last month. Unlike 2021, today I would trust signals sent by the Average and Median prices. It is a complicated topic but I hope the explanation helps to avoid confusion around different price metrics and signals they are sending today.
I also have a model which indicated the first signs of potential weakening in December 2021. During both episodes of divergence in 2017 and 2018 model served as a trend line where actual prices reverted, so we’ll see how it’s going to perform now.
Real Estate Investment
As a result of rising bond yields, mortgage rates, and condo prices Totonto Metro investment attractiveness metrics deteriorated significantly. Cash flows declined so much that new investors can barely break even after principal payments recapture.

This is a truly unprecedented state which is unlike 2017. Again, switching to a variable rate helps a little but the overall trend remains intact.
This is particularly alarming since 2022 will be the first year when new construction condo investors with units completed this year are expected to face a negative cash flow issue.

Another investment attractiveness metric - risk premium over bond yields, which would be more relevant to wealthy investors and corporations who are able to purchase real estate with cash has also deteriorated to a record low level. Investments in riskier assets require a higher return(premium) over less risky ones and when that premium is low asset class becomes less favorable. Historically returns of all cash-generating investments are compared to the 10-year government bond yields.
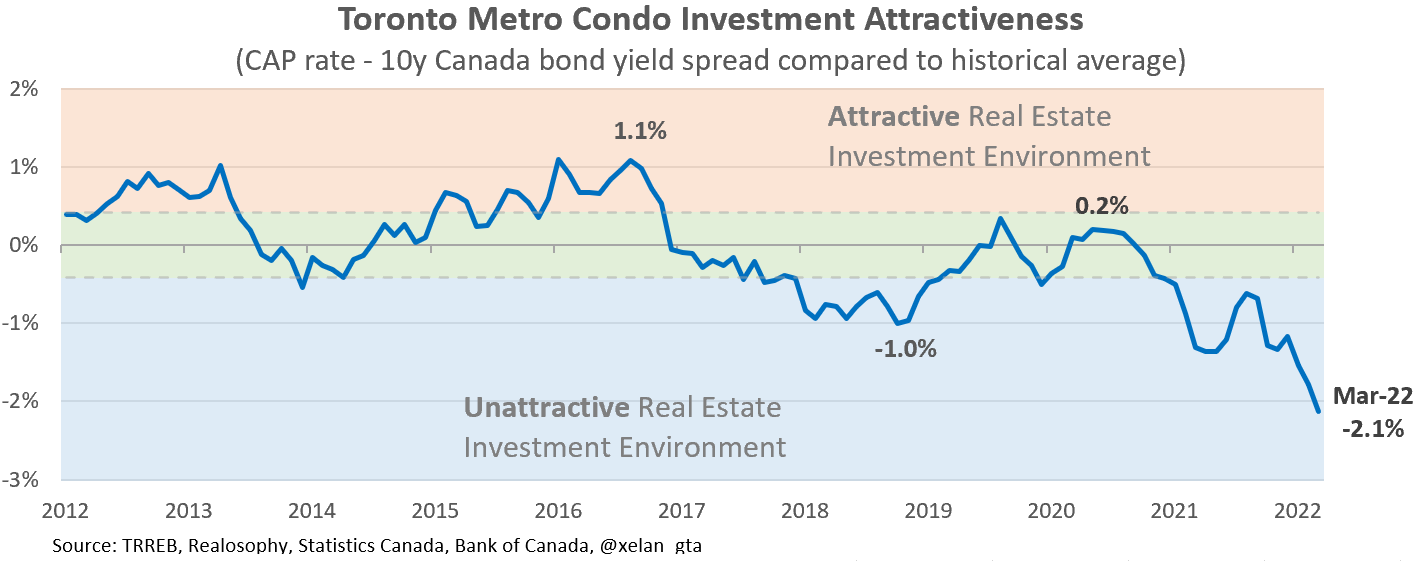
To be fair, rising bond yields reduce the attractiveness of all cash-flow generating assets and not just real estate so deteriorating investment attractiveness is a challenge for all those assets.
Those metrics presented here don’t allow to predict the future but they show that today’s market is exceptionally unattractive for new investors and if they are going to pull away and stop buying that would be completely understandable.
So far there are no signs of it, sales are strong in both resale and new construction(February data) segments.

Rental Market
Rental Market continues to remain tight and it’s also a strong season so rent prices are expected to grow further. Market balance is the tightest since at least 2012 (for the month of March).

Canada’s Real Estate Market
The market slowdown is also noticeable on a national level. Both market balance indicators weakened in February.
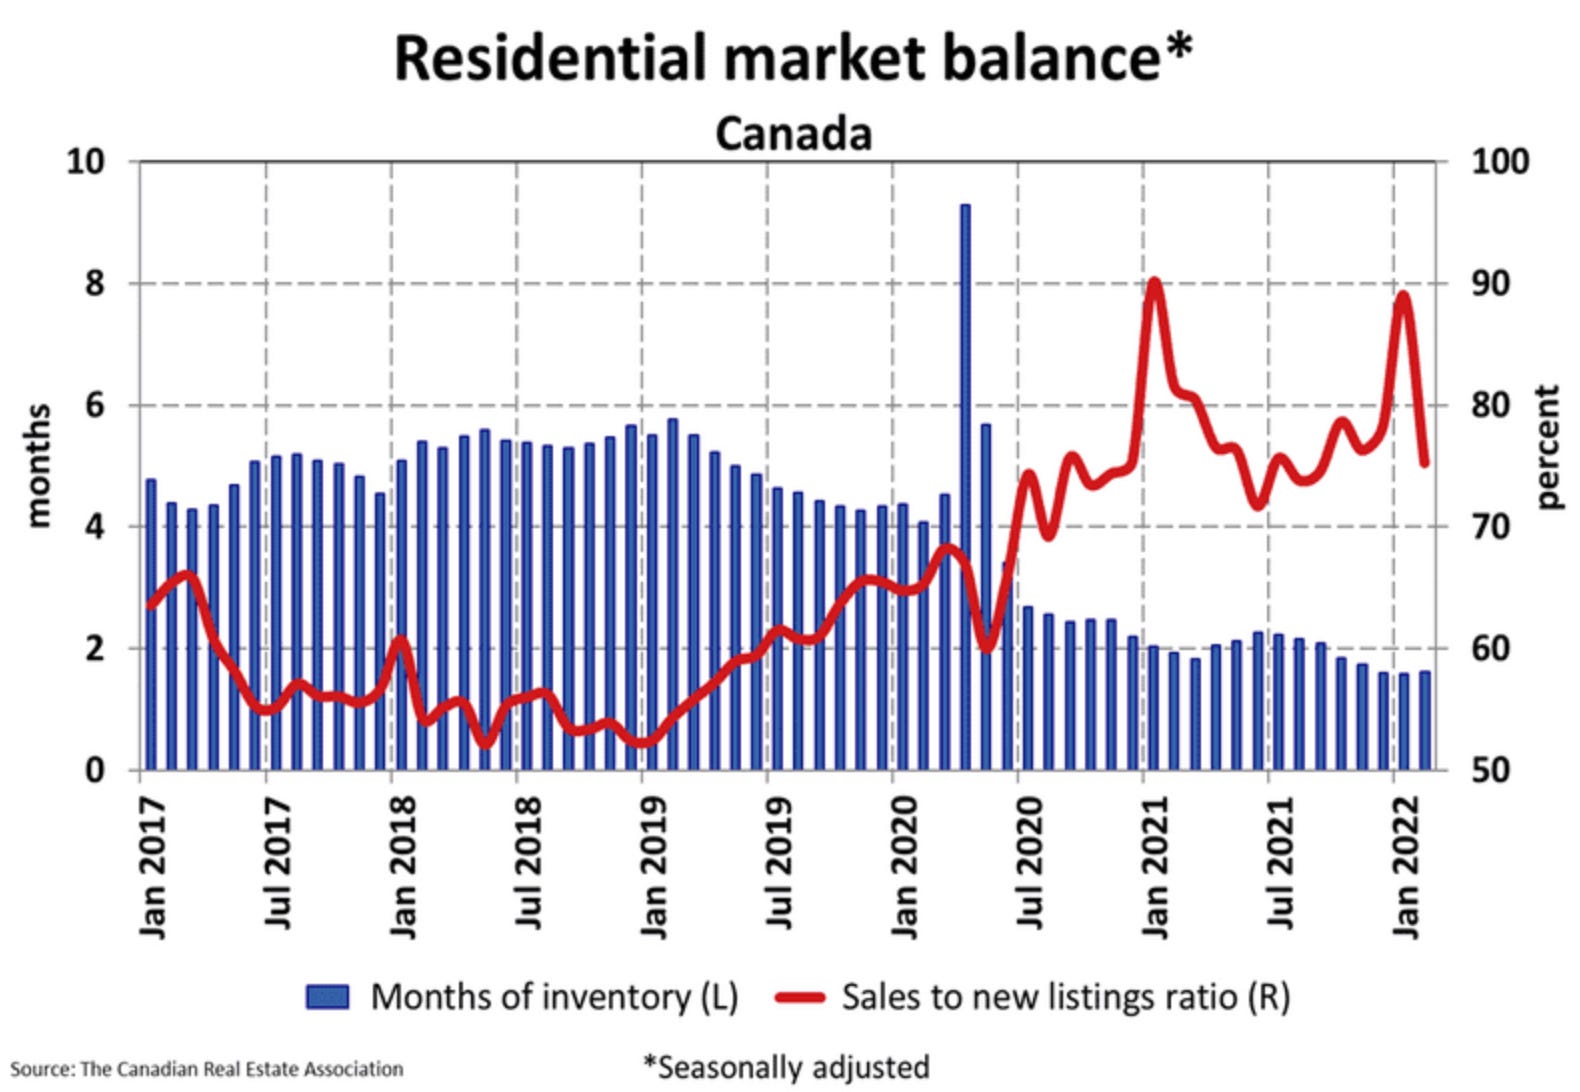
That provides a clue that the slowdown we are seeing in Toronto is likely related to Canada-wide (or even global) factors such as a rise in interest rates and the expectation of a slower market in the future.
Despite first signs of slowdown, market remains very tight and in February Canada-wide benchmark price increased by 5.3% compared to the previous month. This is a 63.2% annualized increase. Canada’s housing affordability is starting to look alarming turning a housing overvaluation risk into a systemic one.
Population Growth
Canada’s population growth ended 2021 on a strong note. It did an amazing comeback in the second half of the year compared to the first one with a seasonally adjusted population growth rate almost doubled from 330k annual rate to 586k.

Inputs into population growth such as immigration and new non-permanent resident permits were record high in 2021, but the resulting population growth of 457,888 was much lower than 2019’s one of 583,364

The reason for that: a much bigger share of immigration in 2021 was sourced from the existing pool of non-permanent residents. When you just re-label a person from non-permanent resident to an immigrant it doesn’t affect population growth.
It sounds intuitive but there is a caveat. There are also non-permanent residents who were planning to leave Canada in 2021 but got PR status and stayed instead, those residents actually boosted population growth. It’s difficult to say how many of such non-permanent residents received PR status in 2021 but typically about 500k-600k non-permanent residents leave Canada every year so potentially it’s a huge pool to tap into.
Labour Market
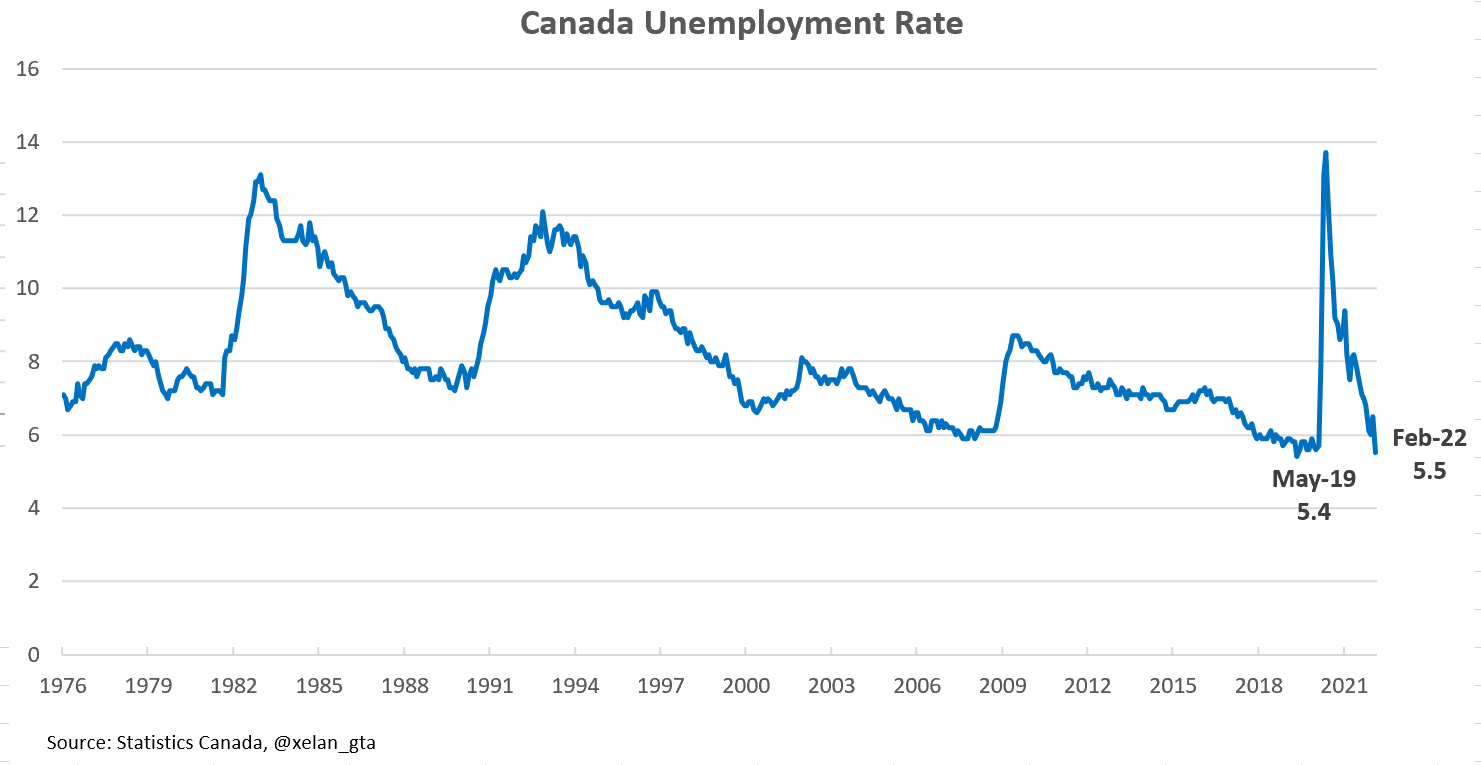
Canada’s labour market recovered at an unprecedented speed to a level that is just 0.1% above the record low since at least 1976.
It continues to provide a tailwind for both resale and rental markets but the closer we are approaching the end of the economic cycle the less upside potential exists.
Late-Cycle Signal
One of the most powerful late-cycle indicators is yield curve inversion and it occurred in March in the US. Normally, long-term government bond yields are higher than short-term ones since investors need to be compensated for higher risk. An inverted yield curve means that longer-term bond yields are lower than shorter ones and it happens when investors expect a decline in longer-term interest rates, typically associated with recessions.

This indicator was very reliable historically but recessions didn’t happen immediately after the yield curve inversion. Historically the lag was about 1-2 years.
As always, past performance doesn’t guarantee future outcomes, but since it has been such a reliable indicator in the past it’s worth highlighting this event.
The comparable Canadian yield curve hasn’t inverted yet based on a daily data but was close to it.
Conclusions
Mortgage rates are on the rise presenting a significant headwind for the housing market. Toronto Metro Housing affordability for homebuyers deteriorated to unprecedented levels and investment metrics that fully justified the real estate market in 2017 took a nosedive as well making the Toronto Metro market a very unattractive place to invest. That comes at a time when new construction investors who historically never had to deal with negative cash flow will have to deal with it in 2022. Housing affordability is deteriorating on a national level as well turning housing overvaluation into a systemic risk.
Risks are mounting and there are plenty of glaring pieces of evidence that the real estate market in Toronto Metro will have to face much stronger challenges in 2022 compared to the previous speculative episode ending in 2017 and the market resilience will be tested with a much stronger force.
Some people are taking those risks seriously which results in plenty of new listings leading to the rapid growth of the inventory well above the seasonal pattern. However, if we look at sales, those are still very strong suggesting that buyers remain pretty confident. So far there is no consensus in the market but sellers are “winning” and pushing the market towards the balanced territory with one of the market balance indicators already reaching it.
Average and Median prices declined in March compared to the previous month but benchmark price continued to rise, even though at a slower pace compared to the previous month. The methodology used for benchmark price calculation creates a lag effect which doesn’t allow us to make accurate conclusions about the latest market price trends during a rapidly changing environment such as the one we are facing today.
Rental Market is the tightest since at least 2012 suggesting further rent prices growth and deterioration of rental affordability.
Macro indicators remain very strong supporting the decision of the Bank of Canada to raise interest rates. The unemployment rate declined to a pre-pandemic level and population growth strongly rebounded in the second half of 2021.
Despite the strong economic landscape investors are starting to express recessionary worries and as a result yield curve inverted in the US in March.
Note: The current newsletter is focused more on the risks and may sound bearish however there is also a bullish side so I’m planning to write a separate post dedicated to a more detailed analysis of the market and some potential outcomes. Aiming to release it in about a week, but notification won’t come via email so check my Twitter posts or publications directly.
Housing Affordability is defined as the share of median household income required to be spent on mortgage payments when buying a typical property. Mortgage payment is calculated using discounted 5-year fixed mortgage rate and 20% down payment. The higher the value - the more unaffordable the market is for homebuyers.
Months of Inventory shows how many months are required to absorb current active inventory at a current level of monthly sales. The lower the value, the stronger the market.
Sales-to-New Listings measures market balance by comparing the number of sales within the last month to the number of new listings during the same period. The higher the value, the stronger the market.