


Toronto Became the Most Expensive Metro Market in Canada Challenging the 1989 Bubble
Overview of important developments in the Toronto Metro housing market and macro reported in January 2022.


We did it! In January Toronto became the most expensive real estate metro market in Canada, beating Vancouver.

It continued to heat up in January without support from fundamentals, a development that banking regulator OSFI called “Speculative Fever”(link).
Benchmark price1 increased at an annualized rate of 52%. No doubt this pace is unsustainable and very likely is going to end soon with the most obvious catalyst being interest rates increases, expected to begin this March. Meanwhile, Toronto Metro market balance2 remains tight.
Another notable milestone in January was the deterioration of the Toronto Metro housing affordability3 to the levels last seen during the 1989 real estate bubble peak.

Housing Affordability metric, although not perfect, is specifically designed to perform historical comparisons. A staggering 61% of median household income is now required to cover mortgage payments on a typical property which is significantly higher than 45%, observed during the housing mania peak of 2017. Usage of the variable mortgage rate improves affordability, however, no historical data is available for variable mortgage rates going back to 1989 to perform a proper comparison.
To provide a better picture of the current Toronto Metro market strength, here is the comparison with the most recent speculative mania of 2017 to see how those two periods stack against each other.

Today’s market already exceeded 2017’s strength by most of the metrics.
Important note: Even though there are clear similarities between the 2017 and 2022 periods you should never assume similar outcomes. Each period is unique and will lead to a unique outcome. Setting any future expectations like: “Market is going to drop by 15% and recover similar to 2017” would be a mistake.
Luxury segment($2M+) was booming in January exceeding 10% of total sales.

Condo sector has been catching up with single-family and based on the latest market balance indicators this process was completed in January. It’s reasonable to expect condos to start outperforming single-family going forward unless market balance changes.
However, in order to support higher condo prices, rents should grow as well, otherwise investment attractiveness metrics start to deteriorate.
Rental Market
Toronto Metro rental market remained tight in January. The tightness is not unprecedented but it’s in line with the 2017-2019 years of strong rent appreciation.

The average rent price of $2,594 is shy of the 2019 peak. Slow season is almost over which is a strong setup for further rent prices growth.
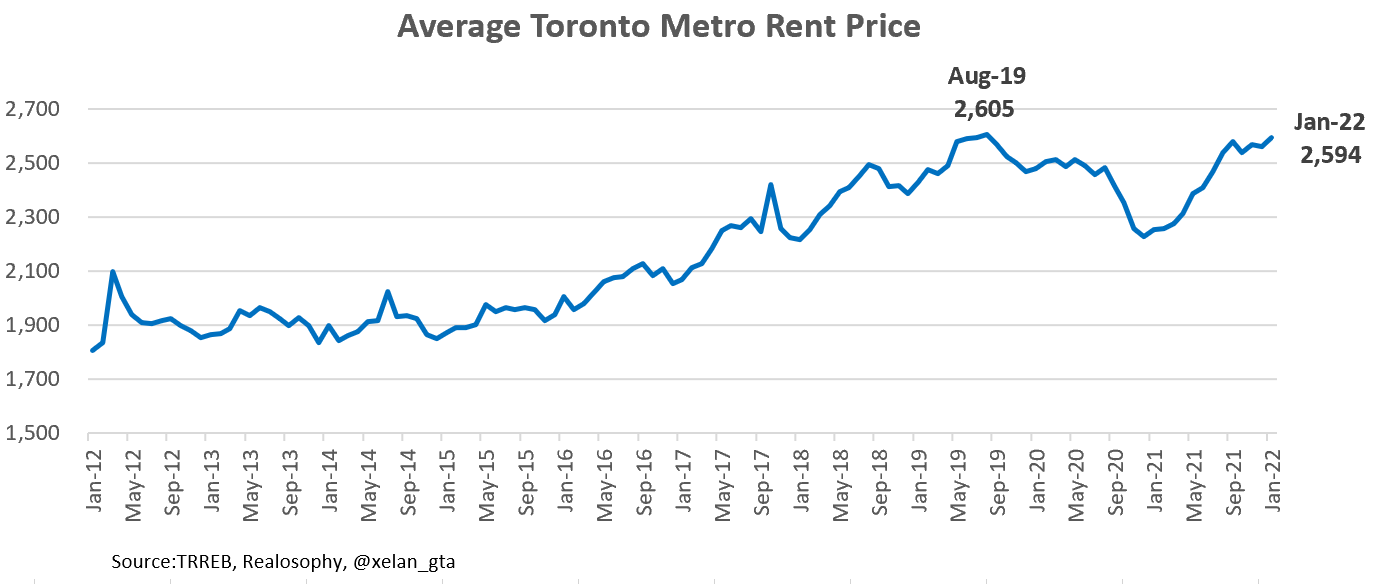
Rental active inventory remains elevated and quite stable.

The main cause of the market tightness is exceptionally high leasing activity. It was strong in January but a little weaker compared to the last year. It also came down substantially from the July peak which was linked to the students’ arrival for the fall semester.

Investment Cash Flow
Both resale and rental markets are strong however the rental market is lagging. As a result, cash flow for condo investments is deteriorating recently.

This is is a headwind for the housing sector. The higher prices grow without corresponding rents increases, the less attractive market becomes for new investors. Rising mortgage rates will also reduce cash flows acting as another headwind.
It is becoming increasingly difficult to justify existing valuations. Despite that pre-construction condo investors are paying a premium on top of existing resale prices with the average price of unsold new construction condos reaching $1,322 psf in Q4 2021., about 100% higher than 5 years ago (Source: Urbanation).
Toronto Metro Population Growth
Recently published Toronto population growth data showed that between July 1, 2020 and July 1, 2021 it increased by only 15,924 which is significantly lower than the 10 year average of 87,547.

During the same period, 37,705 new units were built, which is above the 10 year average of 34,427. Taking into account the average household size of 2.7(Census 2016) that would be enough to house about 102k people. 2021 was the year when the construction industry caught up a little with the housing shortages.

While population growth numbers are never accurate it is still worth looking deeper into the data to understand how Toronto ended up with such low population growth. Here is the breakdown by components:

Reduction of the net international migration(which includes immigration) along with the outflow of non-permanent residents in 2021 are in line with the Canada-wide trends.
I’d like to draw your attention to intraprovincial migration. It includes net result of the people leaving Toronto Metro for other cities within the province. As you can see, people were leaving Toronto Metro even before the pandemic and this trend accelerated in 2021. The main two reasons for people leaving Toronto Metro in my view are housing affordability and the status of an immigration hub where immigrants arrive first and resettle later. Pandemic added more reasoning to leave the city in favor of the suburbs. As a result, Toronto Metro lost more than 70k people within 12 months preceding July 1, 2021. A model built to exclude the impact of the pandemic still shows a significant outflow.

If my thinking is correct and outflow from Toronto Metro is linked to the housing affordability then at the current affordability level model is indicating we should expect about 82k yearly outflow.
This could be one of the overlooked developments with the potential to significantly weaken Toronto Metro population growth going forward until housing affordability improves.
Meanwhile, 44,103 units were pre-sold in 2021 which will be enough to house about 120k people in the Toronto Metro area.

It is a possibility that despite strong immigration rebound supply may continue outpacing population growth, especially if another recession happens in the not-so-distant future.
Inflation and Interest Rates
Bank of Canada released the update to Monetary Policy Report(MPR) in January which showed that they continue revising up inflation forecast with every new MPR. Despite that, the Bank of Canada decided not to raise interest rates. Instead, they pivoted forward guidance from “no rate hikes” to a “series of rate hikes and quantitative tightening ahead”. I shared my view regarding that development on Twitter.


The important takeaway for me was quite a hawkish language which would raise the possibility of back-to-back rate hikes or even 0.50% increase. It seems the current business cycle is all about “quick”. A quick downturn, quick recovery, quick hiking period ending the cycle.
I continue sharing the view that nobody really knows how inflation is going to progress so everyone is playing by the ear which is a dangerous tactic for central bankers since interest rate changes take a lot of time to work their way through the economy and must be done proactively.
Bank of England, for example already hiked interest rate twice and in spite of that not expecting inflation to return within the control range of 1 to 3% by 2023.

Again, I can’t say which inflation forecast is more accurate but with such high uncertainty, monetary policy mistakes are very possible.
Conclusions
January was full of important events and milestones. Toronto Metro real estate market has beaten Vancouver and took the title of the most expensive real estate metro market in Canada. Toronto Metro benchmark price increased by 36% year over year and with the help of a slight increase in mortgage rates they pushed affordability to the level challenging 1989 bubble peak level.
Fundamentals can’t explain such high price increases and even banking regulator is calling it a “Speculative Fever”. This “fever” is already stronger than the one seen in 2017 based on most of the metrics. Regardless, there are no signs of a slowdown yet so it could get worse before it gets better.
Rental market is strong but it can’t match the strength of the resale market. As a result metrics of investment attractiveness are deteriorating substantially. It is very difficult to justify current price levels so when the market inevitably cools off it would be interesting to see how much actual demand exists from homebuyers and investors.
Driven by the strong appreciation and lack of inventory in the resale segment buyers are paying a premium for pre-construction dwellings with a strong level of 44k units sold this year. Much needed housing supply is being added to the construction pipeline.
Bank of Canada revised up its inflation forecast for the fifth time in a row and warned Canadians to prepare for the upcoming series of rate hikes. If that happens it will most certainly cool off the housing market. Meanwhile, homebuyers are trying to squeeze into the market, driven by fear that with higher mortgage rates they won’t be able to afford their desired property anymore. Speculators are rushing in, extrapolating recent price gains into the future and sellers are postponing their decision to sell as much as they can, seeing how their property grows in value every month.
Despite the exceptional market tightness and record low inventory - the market can turn on a dime very quickly, but that day is not today.
Months of Inventory shows how many months are required to absorb current active inventory at a current level of monthly sales. The lower the value, the stronger the market.
Sales-to-New Listings measures market balance by comparing the number of sales within the last month to the number of new listings during the same period. The higher the value, the stronger the market.
Housing Affordability is defined as the share of median household income required to be spent on mortgage payments when buying a typical property. Mortgage payment is calculated using discounted 5-year fixed mortgage rate and 20% down payment. The higher the value - the more unaffordable the market is for homebuyers.