Toronto Metro Resale Market is Not as Weak as You Might Think and Rental Market is Not as Strong
Overview of important developments in the housing market and macro reported in July 2021.
Resale Market
The media continues to focus on the slowdown in sales and moderation in prices.
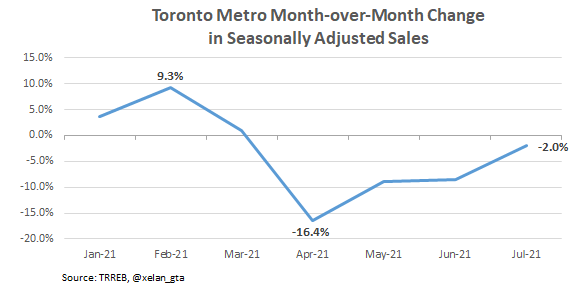
That’s not the main story in my view and even that story is getting old. Sales slowdown is almost over with month-over-month changes approaching regular seasonal pattern.
The main stories in my view are:
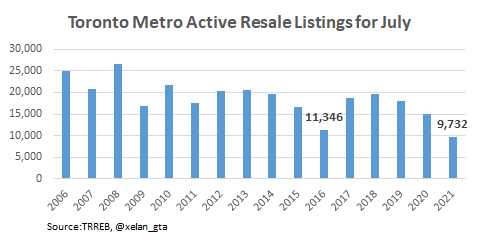
The lowest number of active listings for the month of July within at least the last 15 years;
Very tight market balance indicators and further tightening in Sales-to-New Listings1;
Continued underperformance of the condo sector;
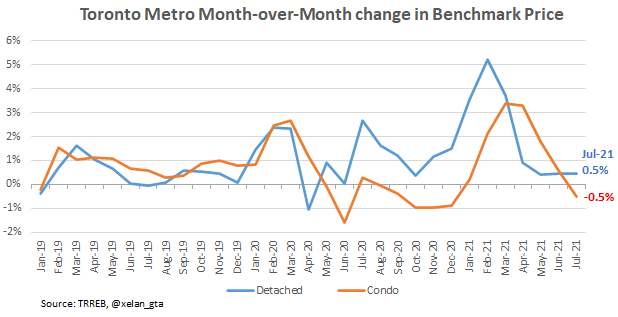
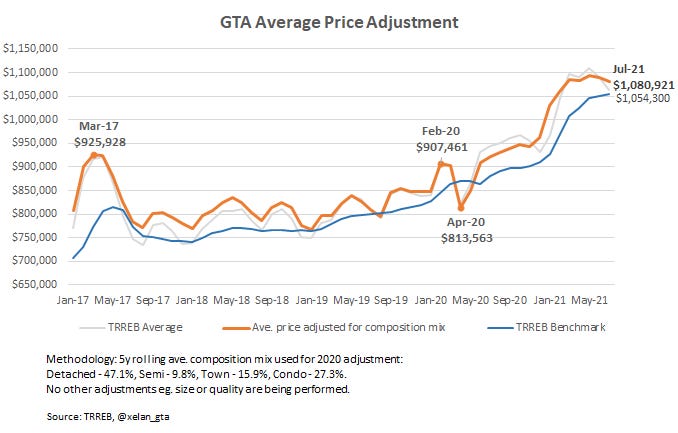
Unexpected softness in real estate prices given how tight the market is.
The lowest number of active listings for the month of July within at least the last 15 years
This development was observed for the first time last month and now it became even more pronounced.
This is a very strong setup suggesting that unless new listings start to grow, any weakness we are seeing in the Toronto Metro real estate market is temporary.
Very tight market balance indicators and further tightening in Sales-to-New Listings
Another important story is that both market balance indicators are still deep in the Seller’s market territory suggesting that the market is very tight and Sales-to-New Listings continues to grow indicating that the market is actually heating up.
Continued underperformance of the condo sector
Condo underperformance is not a new trend but it continued in July. Every month you probably hear that the condo sector is ready to skyrocket and so far it’s not happening.
In fact, the opposite is observed lately, the condo sector is underperforming, however, the pace is very gradual and changes in the market balance indicators are quite small.
Unexpected softness in real estate prices given how tight the market is
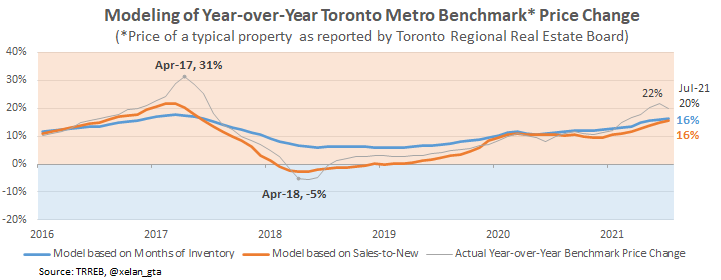
Based on the current market balance indicators Toronto Metro house prices should be growing much faster than they are doing now on a month-over-month basis. This is a notable trend that was flagged last month and continued in July. In my previous newsletter(link) I provided possible explanations for that phenomenon.
I’m happy to see that year-over-year Benchmark Price2 growth slowed down from 22% to 20% approaching closer to my modeled value of 16%. I will continue monitoring this dynamic to verify the accuracy of my models.
On the price softness topic, it’s important to note that Benchmark Price for Toronto Metro condos actually declined in July compared to the previous month. This is a mind-blowing fact for anyone who is closely following the data because the market balance indicator Months of Inventory3 for condo sector is only 1.5. Historically this is a very tight market and prices should not be declining in that setup.
On a side note, average and median prices declined compared to last month.
The main reason is similar to the one in June - fewer condos are being sold compared to other housing types and fewer luxury sales are happening.
Both of those developments are mathematically lowering average and median price metrics and don’t indicate that price of any given property is actually declining.
The slowdown in luxury sales is worth keeping an eye on because potentially it could be a signal from the “smart money” but so far I’m not concerned about it.
Summary
Last month my short-term outlook for Toronto Metro was quite bullish and it became even more bullish in July in spite of slowing down sales and declining average price. I tend to trust the signals sent by the shrinking active inventory and tightening market balance, however, I’m closely watching price action as well, and if it dips below my modeled values that would be a signal for me to re-evaluate the outlook.
At the current rate of the market balance indicators prices should grow at a pace of 17-18% per year.
Rental Market
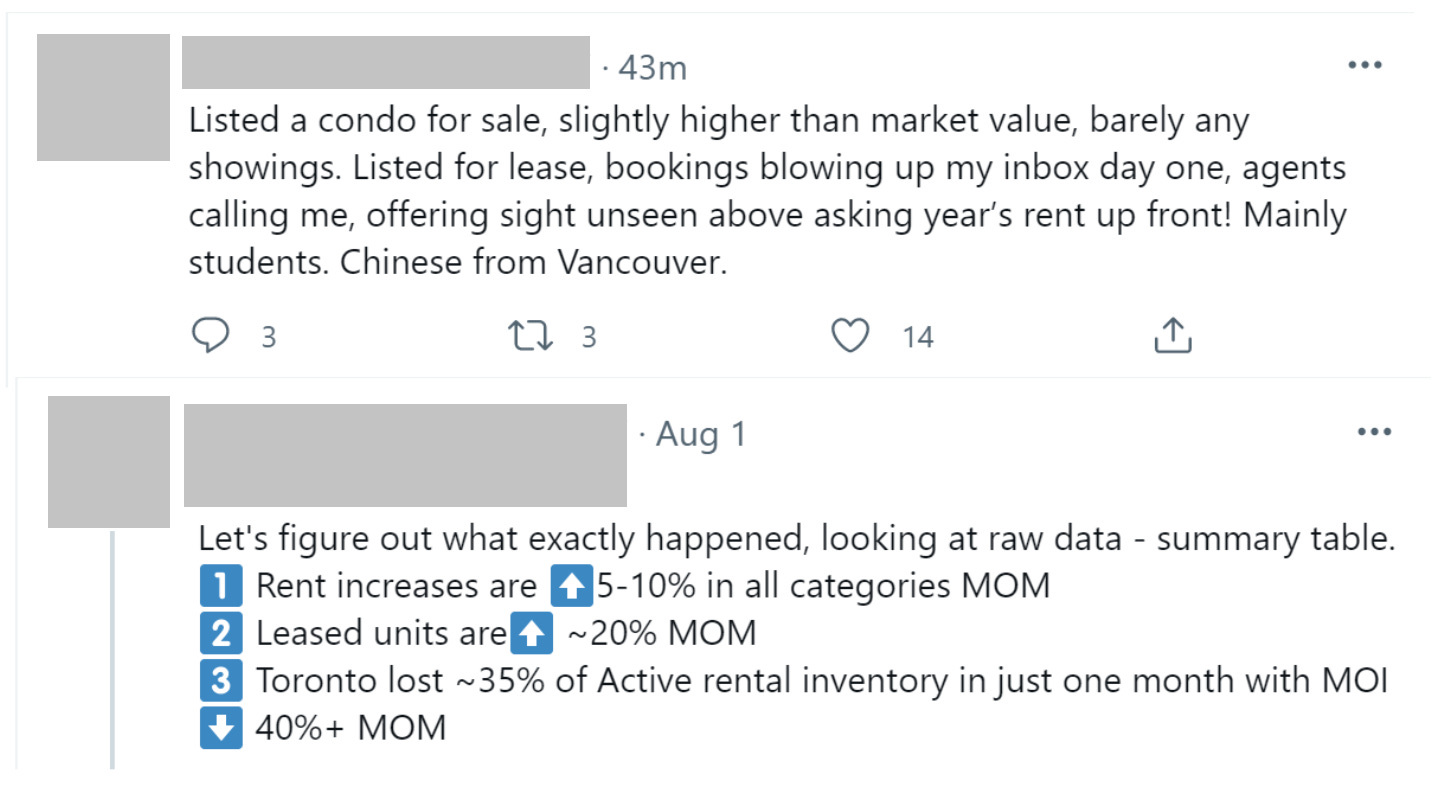
When you scroll through your Twitter timeline most likely you are going to see posts like this regarding Toronto Metro rental market:
Those posts create an impression that Toronto Metro rental market is absolutely on fire causing FOMO4 for those who haven’t taken advantage of the lower rent prices yet.
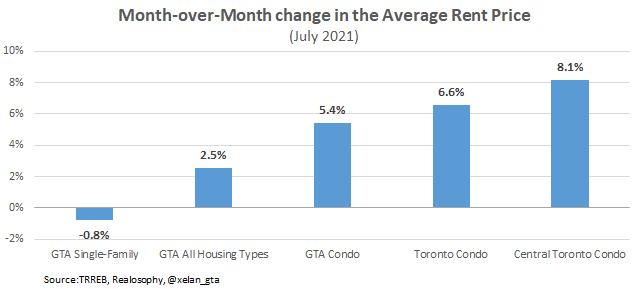
While posts are truthful and genuine those are often focused on the limited area of a person’s expertise, for example, downtown condos, ignoring other parts of the market like single-family rentals which are painting a completely different picture.
I feel that today, the risk of jumping to wrong conclusions in relation to the Toronto Rental Market is very high so I’ll try to provide you the full picture.
Market Balance
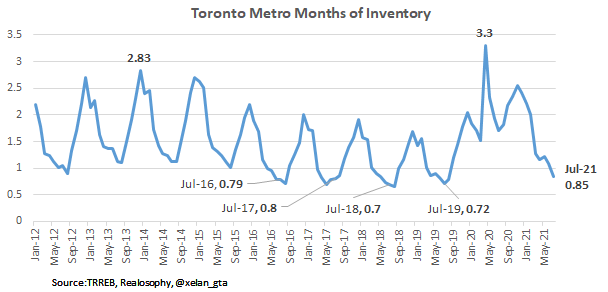
Rental market balance tightened in July deeper into Landlord’s territory suggesting that prices should be growing, however, it’s still weaker than July reading for 2016-2019 years so we shouldn’t expect price growth to outperform levels seen during those years.
For the reference, during the whole of 2016 Toronto Metro average rent price increased by 5.8%, 2017: 8.3%, 2018: 7.4%, 2019: 3.4%
Rent Prices
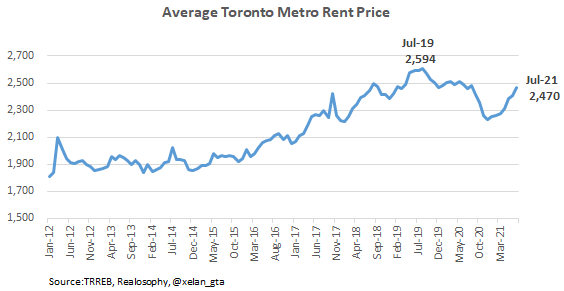
Average rent price continued to grow in July, reaching $2,470 and increasing by 2.5% compared to the last month. It’s still -5.2% below the peak of $2,594 reached in July 2019.
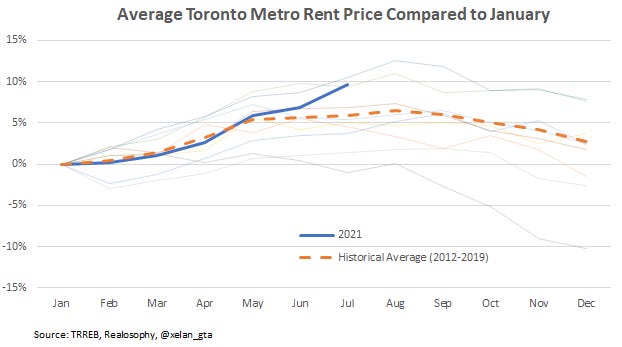
In the previous months, I was pointing out that the rental price growth was very closely tracking seasonal pattern which is not really a sign of strength or market rebound. In July rent prices finally outperformed seasonality suggesting that the market is becoming tight.
Is condo rent prices growth too good to be true?
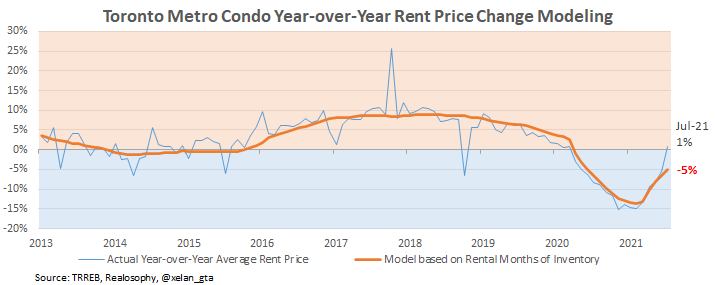
Toronto Metro condo sector month-over-month average rent price increase of 5.4% is a very big jump so I compared it to my model to determine if it’s just a temporary spike or a bigger story.
The model is suggesting that the majority (about 4% out of 5.4%) of that price increase is just a temporary spike which happens pretty often (as you can see on the chart).
Similarly to the resale market, average rent price is affected by various factors such as composition mix, size and quality of the leased units, seasonal and random patterns. Those factors are causing volatility.
Unfortunately, there is no industry-wide Benchmark Rent Price that would be tracking rent price of a typical property so I came up with a model helping to filter out volatility from the rent price changes.
The story behind the strong rental market balance
Market balance indicator Month of Inventory is calculated by dividing the current active rental inventory listed for lease by the current monthly leasing activity. Let’s zoom into each of those two metrics to better understand what’s going on.
Rental inventory
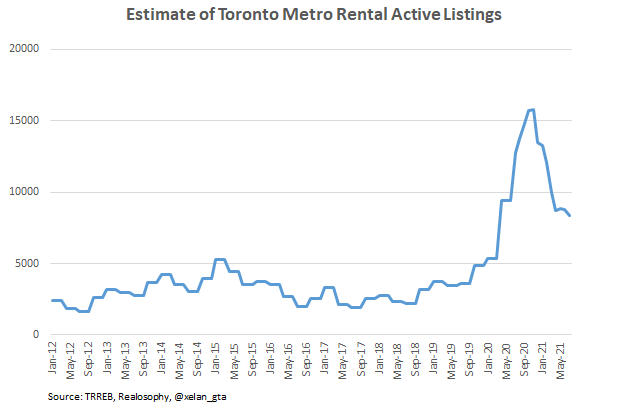
Rental inventory is still very high historically. It needs to decline by at least another 50% in order to lift a concern and allow discussion about the sustainable state of the rental market.
How rental market can be tight with such high inventory? The answer lies in the denominator - leasing activity.
Leasing Activity
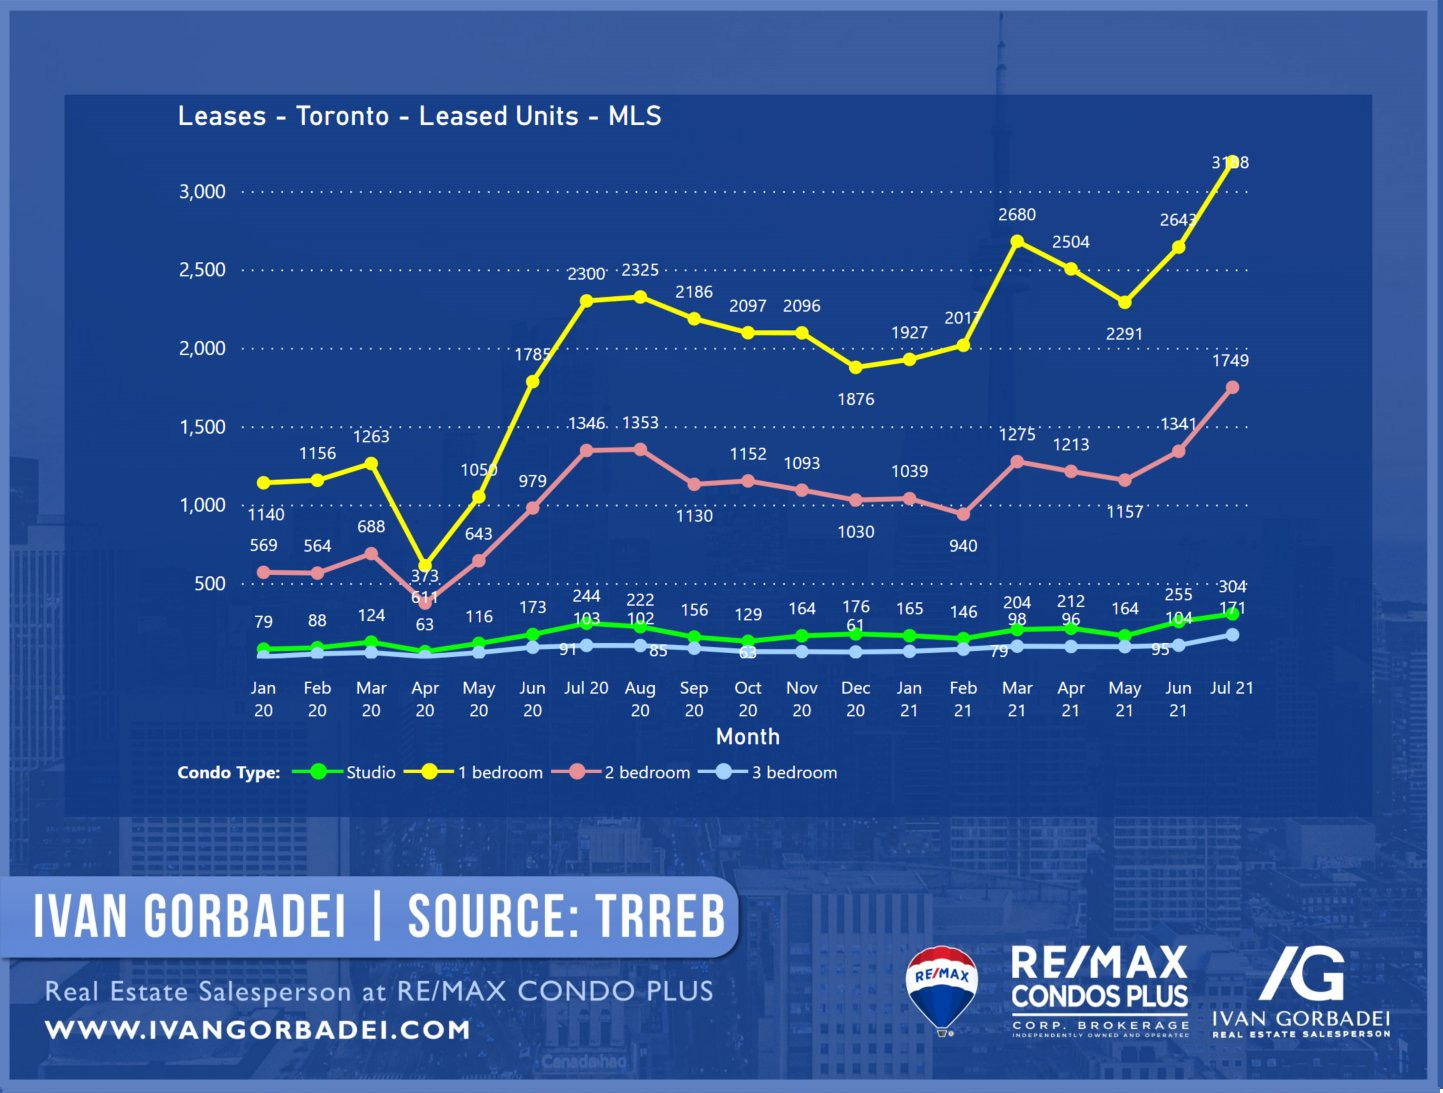
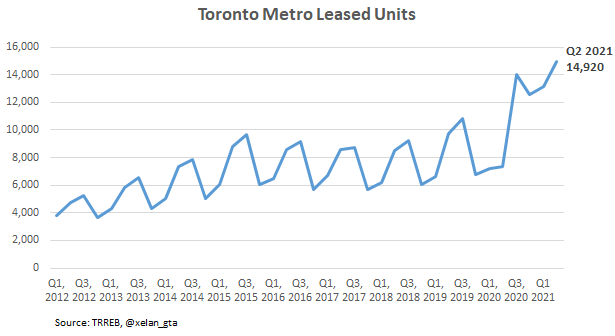
Leasing activity is at a record high. Here is the latest data published by Ivan Gorbadei (@igorbadei)
and also historical context (Please note that the previous chart is for Toronto condos, while this one is for all GTA units, also it’s a lagging data - cumulative Q2 2021):
Why leasing activity is so high? There are several notable factors:
The arrival of International Students and new International Immigrants;
Employment recovery after the downturn;
Renters are switching units to take advantage of lower rent prices and probably rushing decisions to move after learning that the rental market started to rebound;
Massive incentives by the rental buildings (up to 3 months of free rent on a 12 months lease) encourage people to switch units every year to take advantage of the new round of incentives;
People who were postponing relocation due to COVID concerns and now are less concerned after being fully vaccinated.
It is a perfect storm comprised of temporary factors therefore the current level of leasing activity is absolutely unsustainable. Similarly to the crazy sales activity in the resale market early this year, leasing activity will slow down eventually in line with the historical trends. However, for now, that record leasing activity is causing the market balance to be tight and supporting rent prices growth.
It is important to note that it’s very difficult to calculate the contribution of each individual factor in order to make a conclusion about their significance. Maybe when the data for International Students enrolments is released later this year the picture becomes clearer.
I don’t know when exactly leasing activity is going to slow down (aside from temporary seasonal Sep-Feb weakness) but when it happens it will be very important to see where active rental inventory ends up at that time, that’s why I’m closely watching this metric and sharing it via Twitter on a weekly basis.
Conclusion
Toronto metro rental market is strong, there is no doubt about it, but it’s not the strongest on record and the market balance is still weaker than 2016-2019 years.
There is a very big divergence between various segments so it’s important not to make conclusions about the whole rental market based on the performance of specific segments.
The model indicates that Toronto Metro average condo price is growing a little faster than it should which means some temporary factors likely boosting its value.
August is usually a peak of International Students arrivals and seasonal rental market tightness in general so I’m expecting next month to be even stronger.
September leasing activity may also be boosted a little due to possible delays in International Students arrivals but after that, we are entering a period of weak seasonality for the rental market until Feb 2022.
Notable factors which may affect Sep-Feb rental market performance:
Significant increase in the admission of permanent residents;
Transfer of renal units to the short-term rental pool in response to travel reopening;
Record condo completions in 2020-2021;
Release of vacant units to the rental market.
Final Thoughts
Unfortunately, there is no space for the macro data left in this newsletter but I feel that today’s market is quite challenging to analyze so I wanted to unpack a lot of stuff to clarify my view of the market which may sound contrarian.
Both resale and rental markets in the Toronto Metro have tight market balance but the cause of that tightness is very different. Resale market has strong sales at a time when inventory is record low, while the rental market has very high inventory and record-high leasing activity primarily driven by temporary factors.
Resale market is facing an upside risk in this setup while rental market is facing a downside one.
Sales-to-New Listings measures market balance by comparing the number of sales within the last month to the number of new listings during the same period. The higher the value, the stronger the market.
Months of Inventory shows how many months are required to absorb current active inventory at a current level of monthly sales. The lower the value, the stronger the market.
FOMO - Fear of Missing Out


