


The Current State and What's Next for the Toronto Housing Market? (Part II)
A special edition related to the weakening of the Toronto Metro real estate market, the impact of the high rates, and population growth. (October 2023)


Link to Part I (link)
Back in April 2022, I shared my views regarding the potential housing correction in the Toronto Metro area. After more than a year later I decided to look back, review my conclusions and also provide an updated outlook. I’m happy to inform you that some of the views I shared back then turned out to be correct.
Some of my other conclusions can’t be verified yet, and I haven’t found any incorrect calls. Let's begin by reviewing the developments in the Toronto Metro real estate market since January 2022 and comparing them to the housing corrections that occurred in 2008 and 2017.
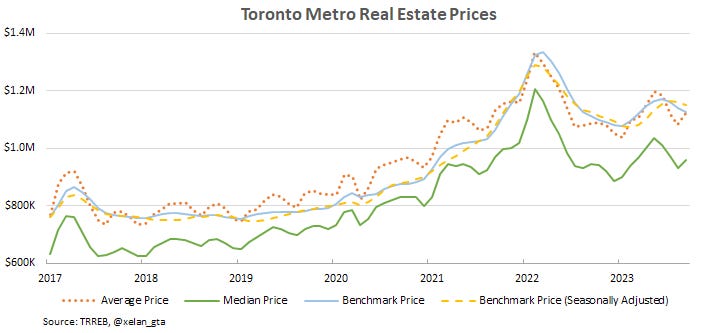
During the first half of 2022, the Toronto Metro real estate market began cooling rapidly. However, after this initial weakening, market balance indicators started to level off around July and remained relatively consistent throughout the remainder of the year. Prices experienced a continuous decline throughout 2022. At the beginning of 2023, market balance indicators began to improve, and price changes reverted to an upward trend. This tightening of the market was primarily a result of new listings shortage and continued until May when inventory began to grow, weakening market balance indicators and resuming a downward trend.
Below are the key metrics that reflect these dynamics, also compared to the previous housing corrections in the Toronto Metro area. To display all the data on a single chart, the dates on the x-axis have been replaced with numbers, representing months since the market peak. The specific timeframes for each downturn can be found in the legend.
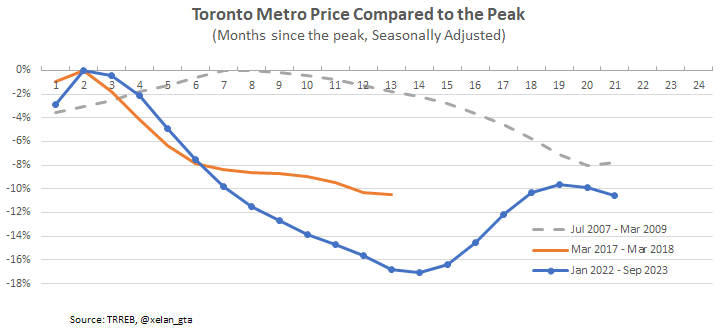
The decline in prices we are currently witnessing is the largest among the last three housing downturns, and more so after adjustment for inflation. By November, it will also be the longest downturn of those three. Active inventory started from a very low level but is gradually catching up.

One of the market balance indicators, "Months of Inventory," is weaker compared to the 2007-2009 downturn, however, it continues to rise. Months of Inventory measures how many months are required to sell all active listings based on current monthly sales activity. A higher value indicates a weaker market.

Another market balance indicator, "Sales-to-New Listings," is weaker compared to the 2017-2018 period and slightly stronger than the 2007-2009 one. Sales-to-New Listings measures the ratio between sales and new listings in the same month. Fewer sales and more new listings result in a lower value, indicating a weaker market.

Now, let's explore how the current market weakness differs from the one observed in 2022 and what can be anticipated in the future.
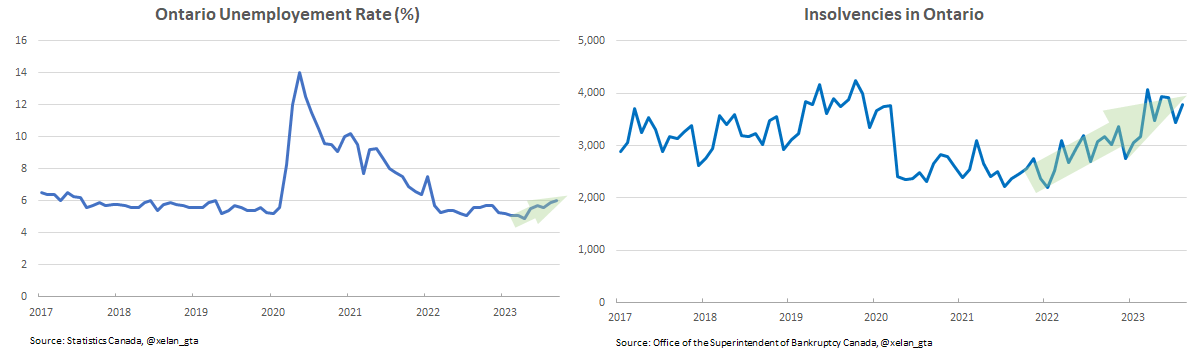
To begin, it's important to emphasize that there is no certainty about the future outcome. In the first part of this article(link), I mentioned that a recession is a necessary condition for sustained affordability improvement, and there is no clear recession at present. However, unlike in 2022, the likelihood of a recession is now much higher, with trends in unemployment and defaults already heading upward.
Temporary increases in inventory driven by speculative market response, like in 2017 or 2022, typically have a short-term impact, however, those resulting from financial hardships could have a lasting effect on the market. It's uncertain if we have already reached a stage where a significant portion of sellers are listing their properties out of financial necessity, but it's a distinct possibility.
Finally, I would like to clarify that while I believe a recessionary environment is necessary for significant and lasting improvements in affordability, it is not the sole cause. Even without a recession, the housing market is not immune to price declines. Weakness in the housing market can, in fact, cause a recession and exacerbate the housing downturn in a self-reinforcing manner.
Price Declines
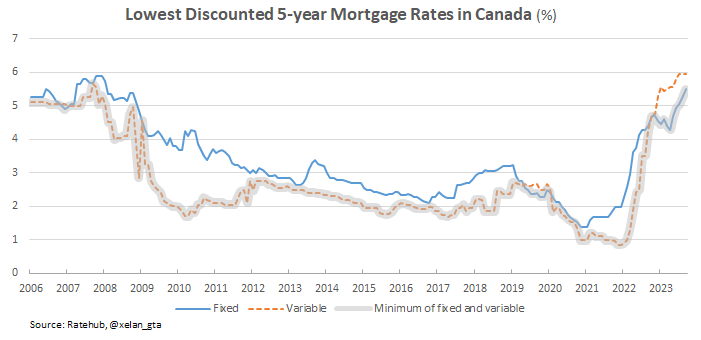
Since the beginning of interest rates tightening the lowest discounted mortgage rate surged from a mere 1% to a substantial 5.5%. This is the swiftest and the most significant tightening in the last few decades. Back in early 2022, I couldn't have foreseen such a remarkable increase.
In the first part of this article(link), I presented preliminary calculations regarding the extent of price decline necessary to counterbalance the impact of rising mortgage rates, ensuring that housing affordability, which relies on mortgage payments, remains constant. To offset the 4.5% increase in mortgage rates observed since early 2022, a substantial 39% reduction in house prices would be required. This modelling assumes that everything else, for example, household incomes, remains intact.

Even if we suggest that mortgage rates will decrease to 4% in the coming years, it would still require a 29% reduction in prices. As of now, prices declined by approximately 16-20% from their peak, based on conventional metrics, and by 11% based on seasonally adjusted benchmark price. This metric lags and is subject to revisions, so it should be taken with a grain of salt.
It’s important to note that this calculation aims to bring affordability back to the early 2022 level and not to an affordable one. The Toronto Metro real estate market was already unaffordable in early 2022, so achieving an average historical level of affordability would require an even more substantial correction.
Lastly, the price decline itself may present a significant risk. While a typical 20% down payment provides a buffer, a decrease exceeding 30% on its own would introduce considerable risk across various segments, including the new construction one.
Housing Affordability
Despite the correction, the Toronto Metro housing market is currently the most unaffordable since at least the mid-1980s.

Interestingly, price declines have already surpassed those witnessed in 2017 and 2008, yet there has been no improvement in housing affordability.

While the housing market is unaffordable for prospective homebuyers, it's also financially unappealing for investors. Various metrics gauge investment attractiveness, however since most investors utilize mortgages to acquire properties, one of the key measures involves assessing the gap between the capitalization rate (cap rate) and the minimum mortgage rates. The cap rate is determined by dividing the property's annual net rental income by its purchase price. In simpler terms, it's akin to the interest rate offered by a savings account. Unlike savings accounts, however, net rental income typically grows over time and real estate investments have an additional appreciation component, however, since changes in house prices are unpredictable this component is speculative and not considered here.
Traditionally, the cash flow component of condominium investment returns outpaced the interest expenses of borrowing from the beginning. However, in 2022, a significant shift occurred, resulting in a situation where borrowing money became more expensive than investing it in real estate. This picture is consistent across a wide range of investment attractiveness metrics.

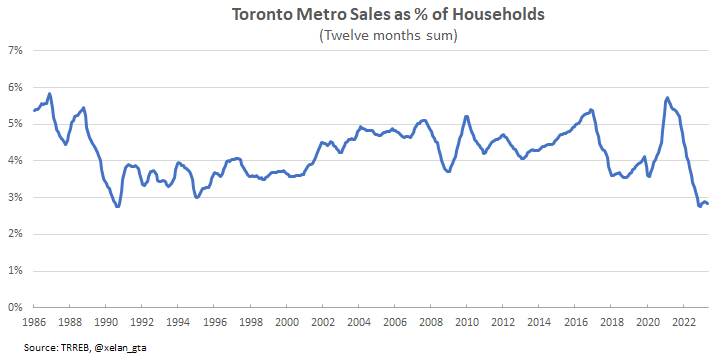
Toronto Metro real estate market defied gravity many times in the past, however, it has never been as unattractive for investors in recent decades. A combination of unaffordable housing, low investment appeal, and growing uncertainty about the future is dampening demand in the market. The Toronto Metro sales relative to the population are currently the lowest since 1991, a trend last observed during the previous major housing downturn.
I don't anticipate a significant recovery in sales until either housing affordability or investment appeal sees an improvement. While there may be occasional temporary spikes in sales, as witnessed in the spring of 2023, these are likely to be short-lived. Alternatively, increasing down payments could boost sales. However, given the rising cost of living and the modest performance of financial assets, this option also presents challenges.
Population Growth
In early 2022, I couldn’t have foreseen such a rapid population growth in Canada. It grew by nearly 1.2 million people in the last year which is almost three times higher than the historical growth rate.

This is a significant fundamental factor because the increasing population requires housing, and it's evident that we are not building nearly enough homes to accommodate this substantial population growth.
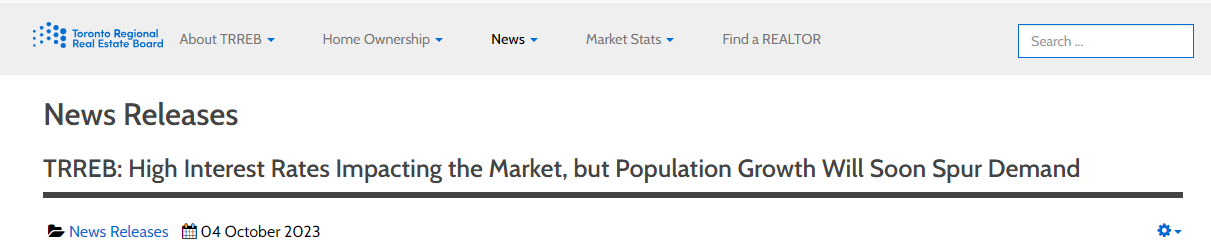
The Toronto Regional Real Estate Board is utilizing this mismatch to offer forward guidance and reassure sellers that a market rebound is around the corner.
While population growth is indeed a robust fundamental, it's not the only one. In my June 2023 newsletter, I expressed caution against categorizing strong population growth as the "ultimate bull case for the housing market" and provided my rationale(link).
Furthermore, in my March 2023 newsletter titled "Population growth - is Canada biting more than it can chew?"(link), I shared more details about the associated risks.
“The risk we are facing is that the record inflows of non-permanent residents today may turn into record outflows in the future.”
Those articles reveal just the tip of the iceberg, there are additional population growth-related risks for Toronto Metro on provincial and municipal levels.
I encourage everyone to learn about all those risks so they are not caught off guard if population growth experiences a significant decline in the coming years. In the event of a substantial economic downturn, it could easily drop below 300,000, even with immigration levels at 500,000. This would represent a decline of 75% or more compared to the current level of nearly 1.2 million per year. Without going too deep into details, it's highly unlikely that Canada will sustain a population growth rate exceeding one million beyond 2024.
Rental Market
Surprisingly, despite the record population growth Toronto Metro rental market has become weaker since the beginning of 2022. On several occasions (link1)(link2), I warned that rental unaffordability may provide resistance to further rent increases. However, I can’t say with certainty that it fully explains the rental market resilience, therefore I’ll just share the latest rental affordability picture.

In the remainder of 2023, Toronto Metro rents are expected to decline, however, I can’t really forecast anything beyond that.
Conclusions
The Toronto Metro housing market resumed its downward trajectory with the most recent readings of market balance indicators reaching the weakest levels since the 2007-2009 downturn. Prices declined by 16-20% compared to the 2022 peak, yet this failed to put even a dent in housing affordability, which is the worst it has been since at least the mid-80s. Real estate investment attractiveness has also reached its lowest point since at least 2012. These factors are resulting in record-low sales, which, as a percentage of the population, are matching levels observed during the major housing downturn in the late 80s.
High interest rates are the primary driver behind the current market weakness, and as long as they remain elevated, the time is working against the sellers. Each day, more homeowners are renewing their mortgages at higher rates, and new construction investors are seeing diminishing equity as their units reach completion. Savings are being depleted, and unemployment is slowly rising. It is reasonable to anticipate continued weakening in the housing market, with prices further declining from their peak values and adding more risk. It's likely that new price lows are still ahead.
In contrast to 2022, I believe we are currently near the peak of housing unaffordability, and it should gradually improve in the future. The extent of this improvement is difficult to predict at this moment.
On the other hand, some data indicate significant household savings accumulated during the pandemic and a reduction in expenses due to the work-from-home setup, which hasn't been extensively studied. These savings, combined with potential wage increases, may enable households to handle higher interest rates than initially expected. For instance, a newly introduced First Home Savings Account(FHSA) alone can result in tax rebates of approximately $2,000-4,000 annually per person for five years. Furthermore, the Bank of Canada and the consensus among economists do not anticipate a severe recession(link).
In the first part of this article(link) I also mentioned that potential government intervention is keeping me up at night. Although since early 2022, the government has demonstrated its willingness to tolerate a decline in real estate prices, the possibility of intervention with measures aimed at stimulating demand persists.
The population growth in Canada surged in the past year, primarily due to a significant rise in non-permanent residents. While this is undoubtedly a positive development for the housing market, it’s not the ultimate bull case in my view.
Overall, I believe short-term risks for the Toronto Metro housing market are skewed to the downside. I will closely monitor market behaviour if prices decline by around 30% compared to the peak and continue to watch for signs of a recession. These signs could originate from either Canada or the global economy. Many housing markets around the world are facing similar challenges, leaving no doubt that we are in the midst of a global real estate downturn. The question is how significant it will ultimately become.
